
Understanding Private Credit: Dispelling the Doom and Gloom
Executive Summary
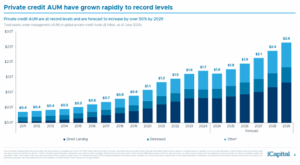
The rapid expansion of the $1.7 trillion private credit market has prompted heightened scrutiny from the media, with recent defaults fueling speculation about systemic risk. However, a closer examination of the data and underlying structures reveals a more measured reality.
- Default rates remain modest, averaging below 3% across private credit and leveraged loans.
- Leverage and coverage metrics remain stable or are improving, with median gross leverage around 5.3x and EBITDA coverage rising from 1.5x to 1.8x as rates ease.
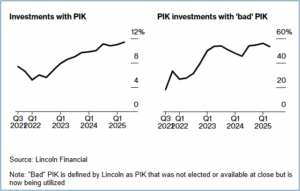
- Payment-in-Kind (PIK) loan share has increased from 7.4% in 2021 to over 11% in 2025, signaling isolated borrower strain but not systemic distress.
- High-profile bankruptcies (Tricolor, First Brands) largely stemmed from fraud in asset-based lending, not from sponsor-backed direct loans, which form the core of the private credit market.
- Systemic risk remains limited, as private credit funds use lower leverage (typically between 1-2x), rely on locked-up equity capital, and maintain minimal direct exposure to bank funding.
The evidence suggests that current challenges represent idiosyncratic stress, not structural instability. For investors, private credit continues to offer attractive yields commensurate with its risks—provided allocations are disciplined and diversified, and capital is invested within the appropriate time-horizon.
Headlines―Fact or Fiction?
In recent weeks, major publications like the Wall Street Journal, Bloomberg, and the Financial Times have published headlines suggesting that private credit might be the next source of systemic risk in financial markets. Highlighting the risks within private credit has some merit—particularly as the asset class has grown to over $1.7 trillion in assets and moved into areas traditionally dominated by banks—but the evidence is more nuanced, and much of the concern is overstated, misunderstood, or misdirected. In this article, we lay out the taxonomy, the current data points, and the practical takeaways for investors.
What Private Credit Really Is
At its core, private credit refers to loans made by nonbank lenders—typically private funds or institutional managers—to private companies. These loans are often directly negotiated, senior-secured, floating-rate, and designed to provide investors with higher yields (for taking on more risk) while offering flexible financing to borrowers.
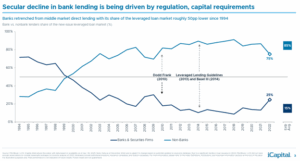
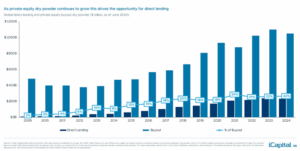
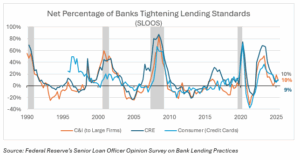
Post-GFC regulations (e.g., Dodd-Frank) constrained banks’ balance-sheet lending and syndication appetite, creating a gap between lending supply and demand―one that private credit stepped in to fill.
Companies are increasingly choosing private credit managers due to their ability to provide swift, flexible, and confidential financing, along with increased reliability of execution—advantages that traditional banks often struggle to offer, particularly in challenging market conditions.
Not All Private Credit Is the Same
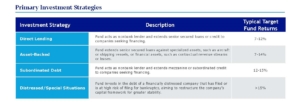
Recent news publications have grouped a wide range of lending activities under the broad label of “private credit.” It’s unclear if there is a motive behind this or simply a lack of understanding, but it is a mistake. While some characteristics of these investment strategies may be similar, they each have different risk/return profiles. A condensed summary is below, but there are further nuances within each category.
The Sources of Concern: PIK Loans, Headline Defaults, and Systematic Risk
The recent spike in attention stems from reports highlighting the growing prevalence of payment-in-kind (PIK) loans, a handful of distressed deals, and general concerns that private credit could spark a financial crisis.
PIK refers to a type of noncash interest payment arrangement in which the borrower pays interest by issuing additional debt or equity rather than paying cash. This mechanism preserves the borrower’s liquidity but increases the loan’s principal over time, compounding the borrower’s total debt load. Private credit markets are seeing a sharp rise in PIK usage, which could signal stress among borrowers who are struggling to keep up with higher cash interest payments. The share of deals with PIK features climbed from 7.4% in Q3 2021 to over 11% in Q2 2025, a four-year high according to data from Lincoln International.
It’s worth noting that not all PIK is viewed equally. “Good” PIK is a strategic, upfront financing tool used by financially healthy, high-growth companies to conserve cash for business expansion. In contrast, “bad” PIK is a reactive measure for companies in distress, signaling weak cash flow and acting as a stopgap to avoid immediate default. While good PIK is planned and growth-oriented, bad PIK is a sign of credit strain, increasing a struggling company’s debt burden through compounding interest.
If the rise in PIK loans stoked fears, recent headline defaults have fanned those flames hotter. Tricolor, a subprime auto sales platform, filed for liquidation after a bank uncovered alleged external fraud tied to roughly $945 million in asset-backed loans. Both Fifth Third and JPMorgan disclosed potential losses. Shortly after, global auto parts manufacturer First Brands Group filed for bankruptcy in late September. The company, which designs, markets, and sells automotive aftermarket parts, had pursued an aggressive acquisition strategy—completing more than 20 deals between 2018 and 2025 worth about $4 billion. These acquisitions, financed largely through term loans and supply chain facilities, drove its total debt up by more than $5 billion, according to company reports.
Media outlets have poured more fuel on the fire by claiming that the insatiable demand for private credit has led to lower underwriting standards, and the overall opaqueness of private credit could cause the next financial crisis.
Was Private Credit to Blame for the Bankruptcies?
The media has been heavy on accusations, but light on details. To start, both Tricolor and First Brands primarily relied on loans from the Broadly Syndicated Loan (BLS) market―not from private credit lenders. Unlike private credit, where one or a small group of direct lenders hold the loans, BSLs are originated by banks and then sold to a wide range of investors. In addition, these were asset-based-lending loans backed by inventory or receivables (factoring), which is a growing but still relatively small subset of private credit. These structures differ significantly from a typical private credit loan, which is a senior, directly originated loan to a private equity-backed company and secured by the entire company’s assets. Despite these facts, the media has generalized the details and called out the riskiness of private credit, even though the actual exposure to private credit is relatively small as of this report (11/4/2025).
iCapital has conducted thorough research and reported:
“Direct exposure to these bankruptcies is limited. Tricolor poses minimal risk, as its subprime consumer ABS and warehouse lines were largely bank-financed,1 with little to no known exposure across BDCs or private markets as of Q2 2025.2
First Brands, however, has broader touchpoints given its $5.8 billion in term loans,3 though still modest in aggregate. Based on our analysis of Q2 2025 data, 15 BDCs―11 private and four public―held a combined $237 million (at principal) in primary exposure to First Brands.4 This represents just 0.05% of the $503 billion in AUM held across the 166 funds in the public and private BDC universe.5 For most of these funds, First Brands account for less than 2% of net assets.
There is also some secondary exposure through collateralized loan obligation (CLOs), as several BDCs hold CLOs that include First Brands loans. Roughly $2.7 billion of First Brands loans are spread across 517 CLO vehicles managed by 69 firms―amounting to just 0.2% of total U.S. and European CLO collateral.6 Even at the manager level, exposure is minimal, ranging between 0.1 and 180 basis points (bps).7
The more uncertain piece involves the indirect exposure to First Brands’ $8 billion in off-balance-sheet financing.8 Reported exposures include Jefferies’ Point Bonita Capital, UBS’s O’Connor hedge-fund unit, Millennium, and Japan’s Norinchukin Bank.22 Importantly, many of these OBS financing claims are still being adjudicated―determining which receivables are valid and which lenders hold priority―and will take time to play out fully. While this may create some temporary noise, the potential losses appear concentrated in a handful of names and do not signal broader contagion across private credit.”
Both cases involved alleged fraud tied to double pledging collateral and obscuring total debt levels. A third case, involving BlackRock and HPS Investment Partners, emerged on November 1, 2025. While details remain limited, it appears to share similarities with Tricolor and First Brands—receivables-backed loans that defaulted amid allegations of manipulated asset and liability reporting. Although these consecutive fraud cases could foreshadow future credit stress, they appear more idiosyncratic than systematic. Blaming “private credit” and extrapolating financial contagion is not supported by the facts.
The State of the Private Credit Market: What the Data Says
Across most objective indicators, the private credit market is showing signs of normalization rather than deterioration. iCapital has compiled data showing that the aggregate fundamentals across private credit and leveraged loans remain stable and may improve as rate cuts ease interest burdens.
- Upgrades outpacing downgrades: The downgrade-to-upgrade ratio in leveraged loans for September reached its best level since April 2024, signaling stabilization in credit quality.9
- Distress levels at relative lows: Only 2.4% of BDC loans10 and 0.9% of private credit CLOs11 trade below 80 cents on the dollar (a common indicator of stress). Leveraged loans overall sit near 2.9% versus greater than 8% during broader credit stress events.12
- Leverage stable: Median gross leverage ratios across private credit portfolios have remained stable around 5.3x over the past few quarters,13 signaling that companies have managed to preserve margins and remain conservative in balance sheet management.
- Coverage ratios improving: EBITDA coverage has increased to 1.8x from 1.5x in late 2023, with expectations for further gradual improvements as rates decline.14
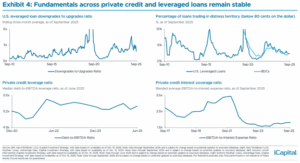
Furthermore, loan-to-value (LTVs) within sponsor-backed direct lending remain healthy (around 40-50%), meaning portfolio companies would have to lose nearly half of their value before loans face impairment. While default rates have risen since 2021, the Proskauer Private Credit Default Index shows they still remain below 3%.
Together, these metrics depict a market that has weathered the 2022–2023 rate shock and is stabilizing on a stronger footing, with modest defaults, conservative leverage, and improving interest coverage.
Private Credit Is Not Riskless: Higher Yields Require More Risk
The data above clearly shows that private credit carries risk. Investors should recognize that while private credit may help reduce interest rate exposure, it typically introduces greater credit and illiquidity risk. There is no free lunch; higher returns in private credit come from assuming high levels of risk.
The main driver of risk in private credit is the overall health of the economy. If GDP growth is stable and unemployment remains low, the asset class tends to perform well. However, if economic conditions deteriorate, private credit will likely experience elevated stress and defaults, but so would public credit.
Risks more specific to private credit include the potential for persistently high base interest rates. While these rates boost yields for investors, they can strain borrowers’ ability to repay debt. So far, the elevated interest rate environment since 2022 hasn’t caused significant stress, as borrowers have continued to increase profits on the back of a strong economy. However, the rise in bad PIK loans could signal growing pressure from higher borrowing costs. We are monitoring PIK exposure within our managers and hope to see it ease since the Fed began lowering rates.
Another risk is rising competition, which can compress yields and potentially compromise underwriting standards. As noted earlier, most private credit activity involves direct lending to private equity-backed companies. Recently, the private equity industry has struggled to return capital to its investors amid weak exit conditions. With fewer exits, deal flow has slowed, forcing private credit lenders to compete more aggressively for a smaller pool of opportunities. At the same time, banks are growing weary of sitting on the sidelines and are reentering the market, intensifying competition. Combined, these dynamics have led to narrower spreads and legitimate concerns around relaxed underwriting standards.
Tracking indicators such as PIK usage, interest coverage ratios, LTVs levels, nonaccruals, and covenants can help identify the quality of underwriting. Although excess capital (“dry powder”) in private equity and private credit continues to create supply pressure, lending opportunities should improve for private credit as the exit environment improves.
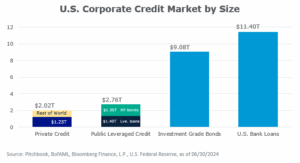
Regarding concerns related to private credit transparency and the possibility of financial contagion, while the growth of private credit could add stress to the financial system, several factors suggest the risk is limited. First, although private credit is less transparent and valuations are more closely controlled by managers, this structure can reduce speculation and dampen portfolio volatility. Second, private credit represents a relatively small share of the overall U.S. corporate credit market.
Third, private credit could actually help prevent or lessen the severity of a financial crisis. Banks typically restrict lending during periods of economic distress, when borrowers need access to capital the most. In those moments, private credit could step in and provide a stopgap to keep capital flowing.
When comparing private credit and banks, private credit funds employ significantly less leverage than banks because of their distinct business models, funding sources, and regulatory environments. Banks often operate with leverage ratios of 10:1 by funding loans through depositor capital, while private credit funds typically maintain ratios below 2:1 and rely primarily on investor equity commitments. This equity-based structure makes private credit less vulnerable to liquidity runs and enables managers to adjust leverage more flexibly during periods of volatility or rising interest rates.
Practical Advice for Investors
To avoid any misunderstanding, we want to reiterate that investing in private credit involves additional risk. The data and arguments above are meant to educate investors and help them make informed decisions about whether private credit offers an appropriate risk/return opportunity. We believe it can―but only when coupled with an appropriate time horizon. If your private credit allocation is intended to meet cash flow needs within three years, consider reallocating that capital to a more conservative investment.
Within private credit, investors should focus on selecting skilled managers, maintaining diversification across sponsor quality and sector exposure, and consistently monitoring portfolio metrics such as PIK usage, coverage ratios, and nonaccrual rates. We favor direct lending strategies managed by firms with long track records, deep experience, and the resources to take over a business if the borrower defaults and goes bankrupt.
Looking ahead to 2026, private credit performance will hinge on economic conditions and a rebound in private equity deal activity. As rate cuts materialize and refinancing activity resumes, fundamentals should strengthen. Investors should expect private credit yields in 2026 to remain attractive, typically in the 8–10 % range, offering a notable premium over public high-yield and investment-grade bonds. Although isolated defaults will continue, private credit managers who maintain disciplined underwriting are positioned to weather risks and deliver attractive risk-adjusted returns.
- Barron’s, as of Oct. 6, 2025.
- BDC Credit Reporter, Advantage Data, as of Sept. 29, 2025.
- Morgan Stanley, as of Sept. 26, 2025.
- iCapital Investment Strategy Analysis, LSEG BDC Collateral, Advantage Data, SEC filings of Company data as of Oct. 15, 2025. Note: Primary exposure includes BDCs with direct ownership to First Brands debt/loans. It doesn’t take into account fund ownership of First Brands via collateralized loan obligations.
- iCapital Investment Strategy Analysis, LSEG BDC Collateral, Advantage Data, SEC filings of Company data as of Oct. 15, 2025.
- Morgan Stanley, as of Sept. 26, 2025.
- Morgan Stanley, as of Sept. 26, 2025. Note: A basis point is 1/100th of a percentage point
- Financial Times (FT Alphaville), as of Sept. 29, 2025.
- PitchBook | LCD, as of Sept. 30, 2025
- Houlihan Lokey, Advantage Data, as of Mar. 31, 2025.
- Morgan Stanley, as of Sep. 4, 2025.
- iCapital Investment Strategy Analysis, PitchBook | LCD, as of Sept. 30, 2025
- Lincoln International, as of Jun. 30, 2025.
- Houlihan Lokey, Advantage Data, as of Mar. 31, 2025.