

Innovation and productivity―both stalwart cornerstones of civilization―are also traits that apply to finance and investments, directly leading to wealth creation. They also increase the variety and availability of investment options, which provide individuals and institutions the ability to participate in and benefit from the quest for constant improvement. In this blog, we'll explore how investors can harness the power of innovation and productivity by investing on a global basis and across various asset classes.
Innovation and productivity―both stalwart cornerstones of civilization―are also traits that apply to finance and investments, directly leading to wealth creation. They also increase the variety and availability of investment options, which provide individuals and institutions the ability to participate in and benefit from the quest for constant improvement.
In this blog, we’ll explore how investors can harness the power of innovation and productivity by investing on a global basis and across various asset classes. This analysis goes beyond a cursory view of the markets to shed light on new opportunities for investors and how they can best position their portfolios for growth.
Today’s Global Investing Opportunities
From the first common stock certificate issued by the Dutch East India Corporation in 1602 to today, the equity markets have evolved into a major source of capital for companies. They are also a key destination for investors’ dollars. Meanwhile, investment in bonds―an even larger market in stocks―has grown continuously since the first sovereign bond was issued by the Bank of England in 1693 to raise money for its war on France.
Today’s investors, both individual and institutional, have access to a broad array of investment choices from both the equity and bond markets. These choices can be categorized in many ways: public and private, equities and bonds, foreign and domestic, high vs. low quality, liquid and illiquid, etc. In total, the investable universe totals approximately $241 trillion across these categories.
What assets are included in the investable universe? Private real estate funds are part of it but the value of direct real estate owned is not. The value of gold held by investors and central banks is included but the value of gold jewelry is not counted. We also avoid double-counting assets. For instance, hedge fund assets are not counted; however, because hedge funds often invest in stocks, bonds, etc., the value of their underlying assets is included. Similarly, exchange-traded fund (ETF) assets are not considered because the value of their underlying assets (stocks and bonds) already are.
The World’s Portfolio
Now that we have defined the investable universe, we can begin to categorize the world portfolio in three broad asset classes: global equities (stocks), bonds, and alternatives. Here’s a look at the global amount invested in each class (all numbers in trillions):
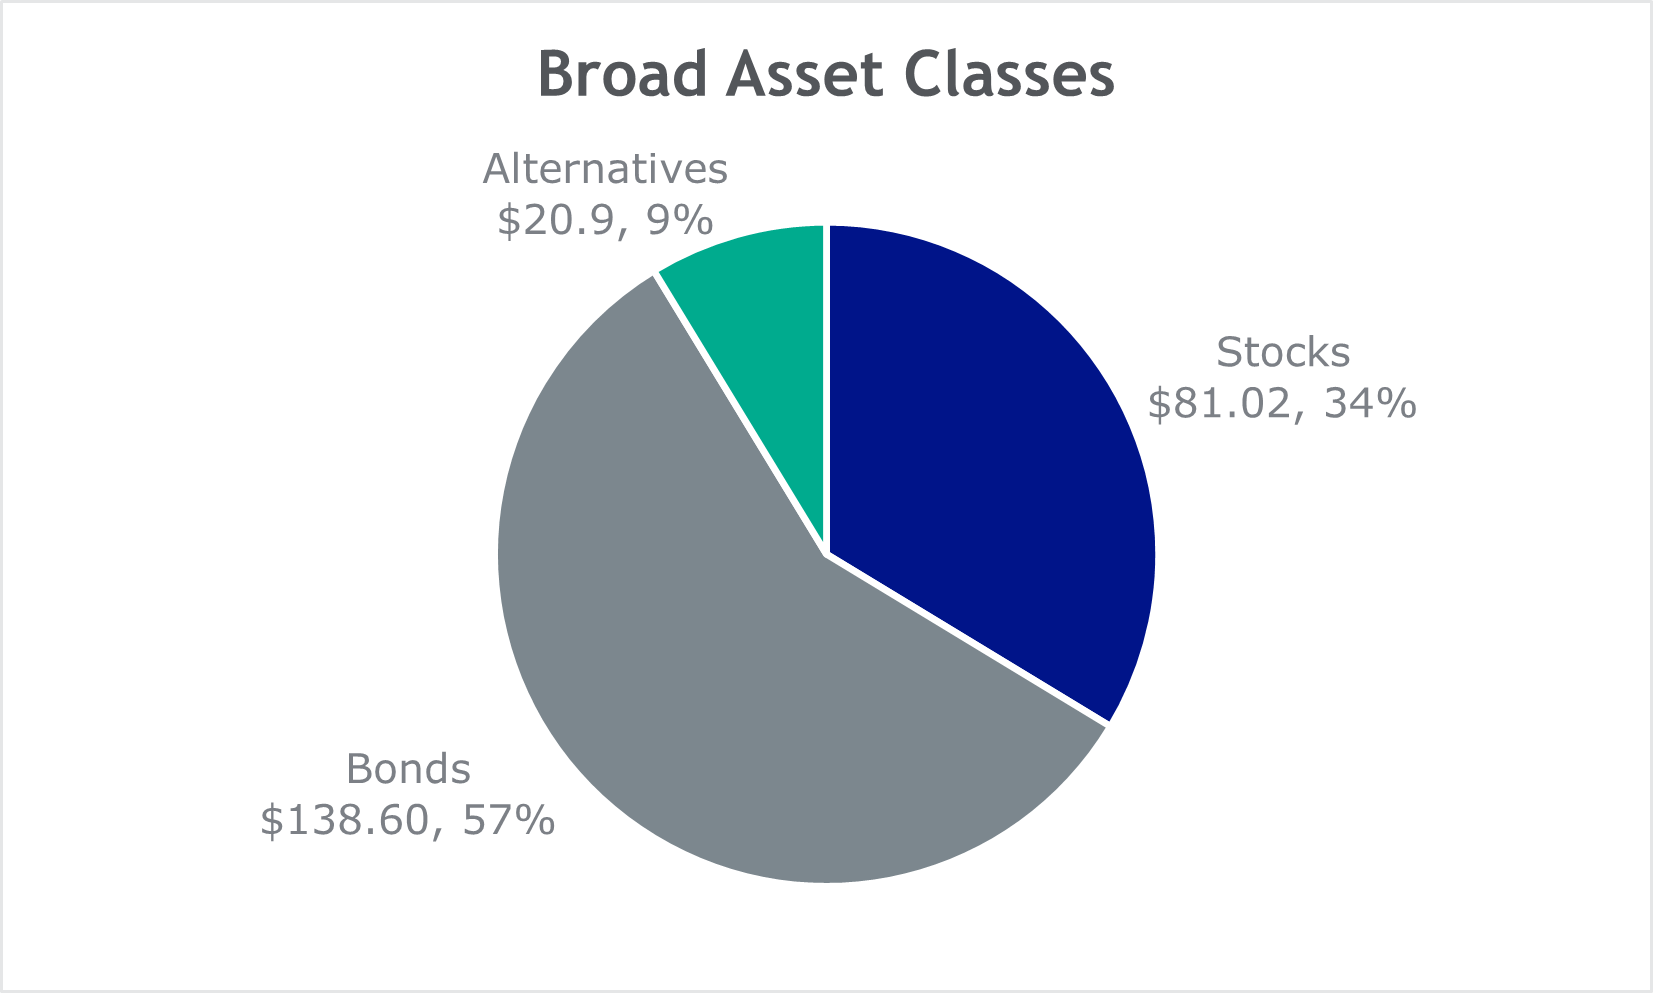
Source: MSCI ACWI IMI (as of 3/31/2024); SIFMA Quarterly Report: US Fixed Income 4Q2023 and SIFMA Factbook 2023; Preqin, World Gold Council, Coinbase (as of 12/31/2023)
As the chart shows, global equities total $81 trillion (34%), bonds $139 trillion (57%), and alternatives complete the remainder of the world portfolio at $21 trillion (9%).
We can view these investable assets as more than just an interesting fact. We can also see them as an investment opportunity set or a broad benchmark. Each investor has a unique time horizon when they will need to access their investments to create income. Investors with long or even perpetual time horizons―such as endowments or sovereign wealth funds―may emphasize longer-term assets within their portfolios. On the other hand, investors with short-term horizons may focus more on bonds and money market instruments.
No matter what their horizon, each investor can use this analysis to identify potential opportunities and risks and determine how to allocate their portfolio in each asset class. For example, one might believe a 20% allocation to gold is appropriate, but a quick look at the weights reveals that gold is roughly 3% of all investable assets. So, then, does 20% reflect a unique investor requirement, or is the outsized position introducing additional risk and creating an opportunity cost by omitting another asset class?
Equity Markets
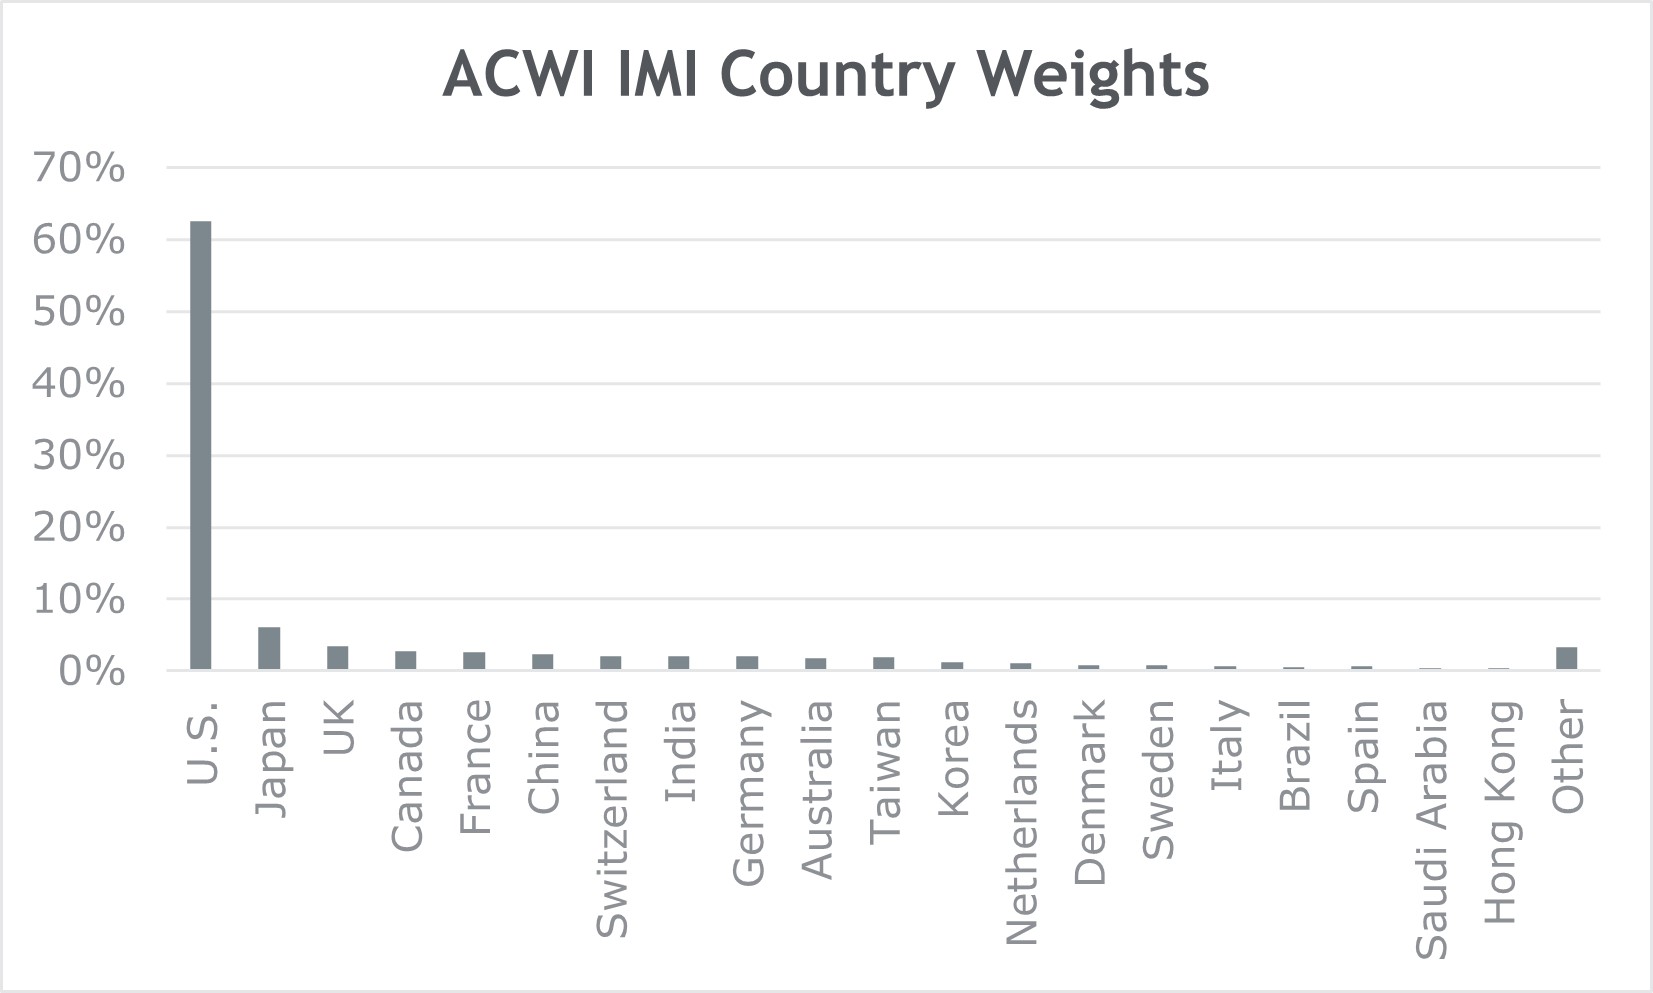
Today, the variety of stocks and bonds for investors to choose from seems endless. For example, the MSCI All Country World Investable Market Index (ACWI IMI) represents equities in 47 countries (23 in developed markets and 24 in emerging markets). As of March 31, 2024, there were 9,033 constituents in that index, representing roughly 99% of global equity market capitalization and totaling $81 trillion. The U.S. accounts for 63% of the market capitalization and contributes 2,378 stocks to the index. Approximately 2,000 additional public companies in the U.S. are not in the index because of their small weights.
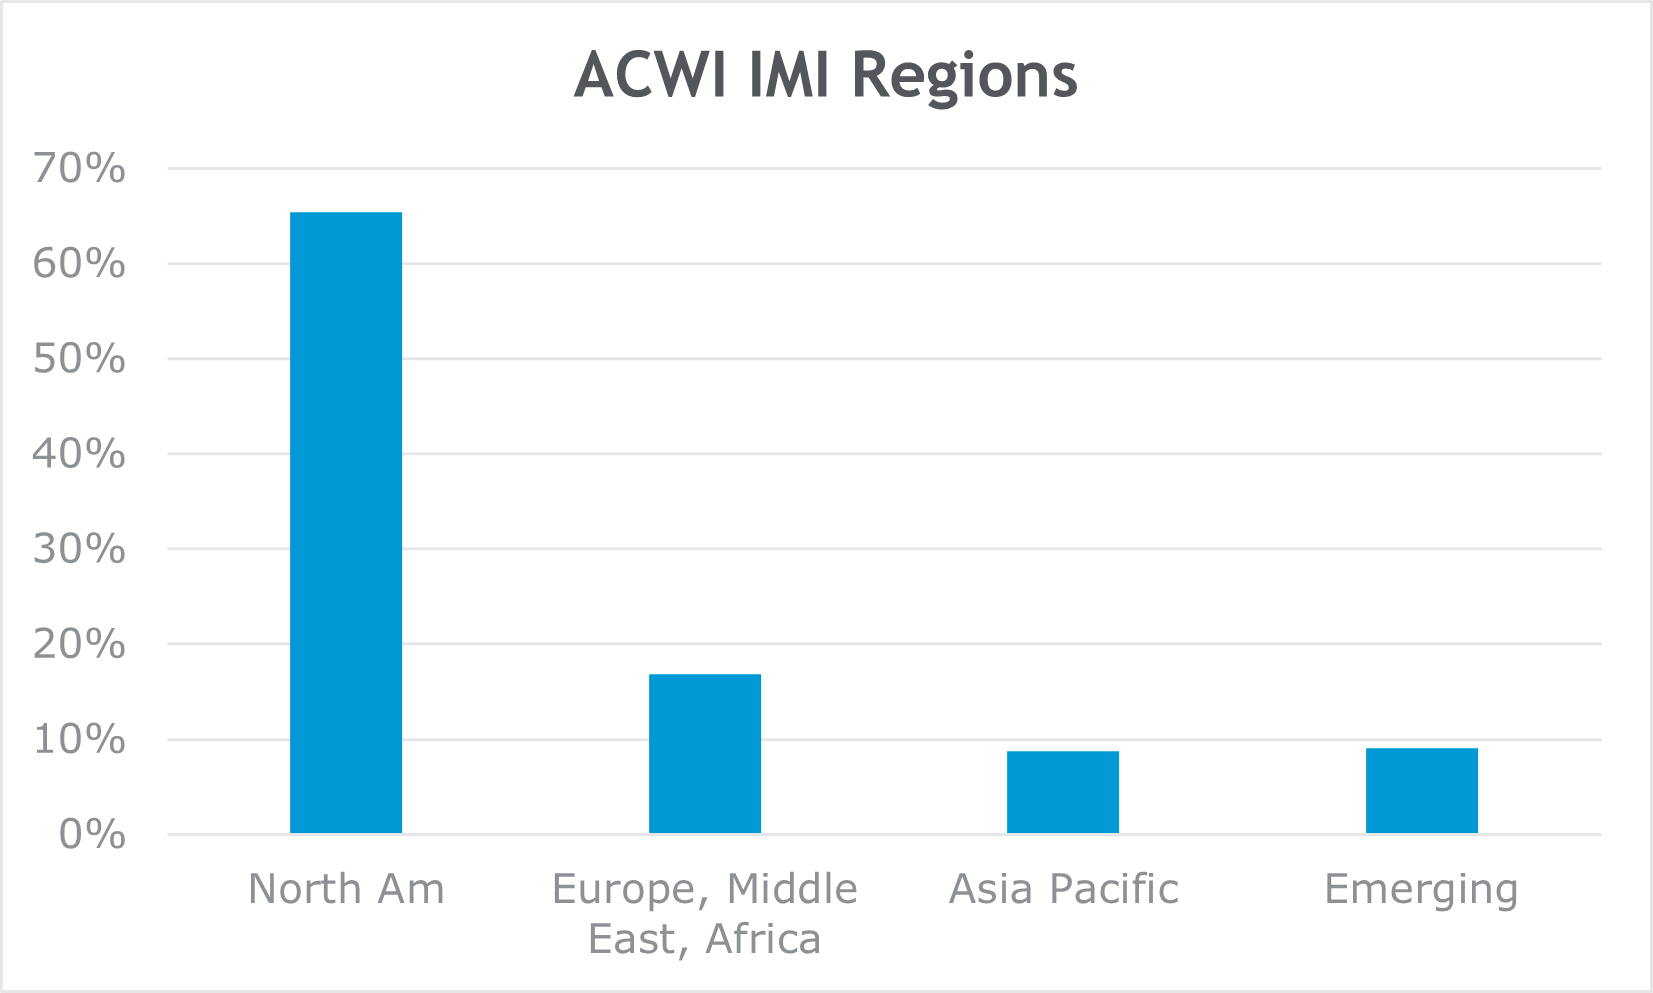
Source: MSCI ACWI IMI (as of 3/31/2024)
While the U.S. stock market dominates world equity capitalization, significant companies in both developed and emerging markets are important contributors to capitalization. Japan has Toyota, the world’s largest automobile manufacturer. BHP, the world’s largest mining company, calls Australia home. NVIDIA, the key chip maker for artificial intelligence, wouldn’t be where it is today without Taiwan Semiconductor (TSMC) to make the chips or the Dutch chip-equipment maker ASML to manufacture equipment used by TSMC.
However, the U.S. markets take advantage of unique circumstances and foresight, including a dynamic economy, immense wealth, rule of law, property rights, and favorable regulatory regime. Companies can flourish and grow to great size as a result. For example, Microsoft and Apple have larger individual weights in the ACWI IMI than all but two of the countries―and one of those is the U.S.
Cyclical factors may be in play, too. Technology companies, a heavyweight in the U.S., have enjoyed a terrific operating environment in recent years. A long stretch of relatively good performance by U.S. stocks plus investor home-bias preferences may have contributed to an overweight in U.S. stocks. However, with high interest rates and inflation still well above the Federal Reserve’s target, other industries and countries may offer new opportunities for investors.
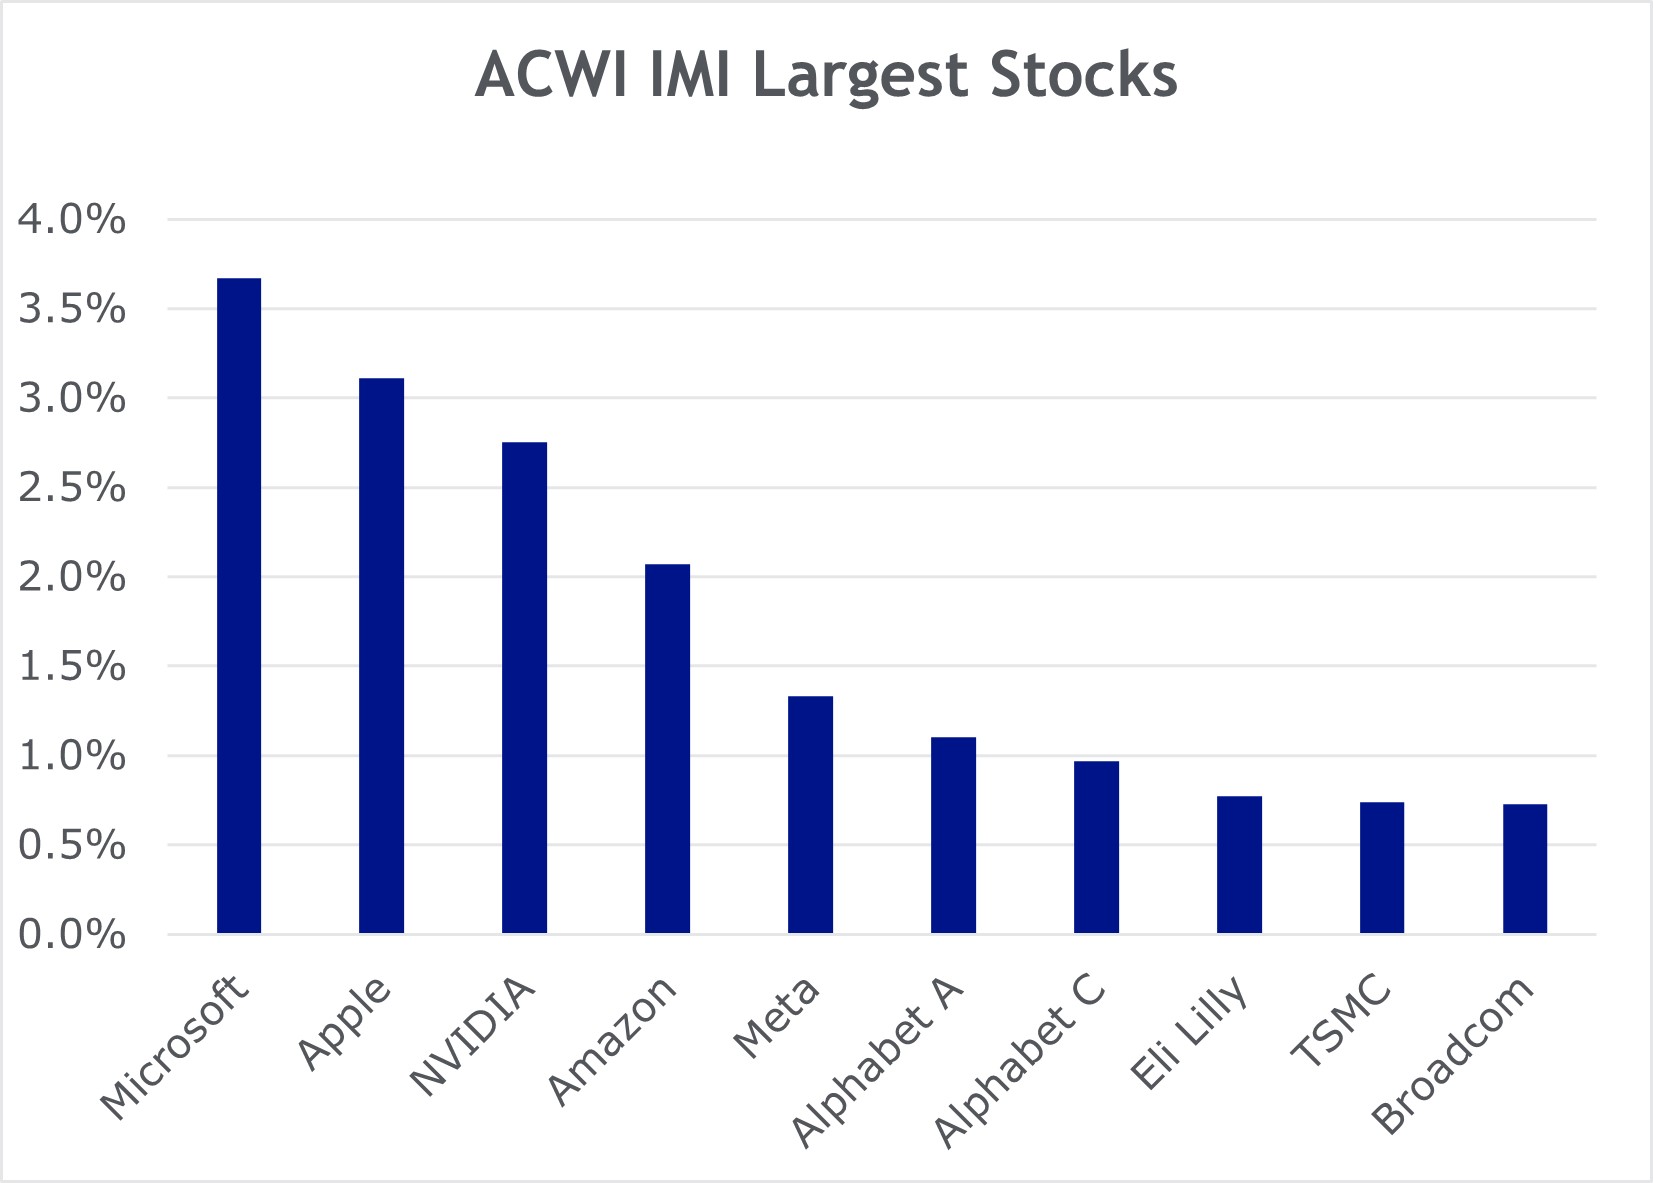
Source: MSCI ACWI IMI (as of 3/31/2024)
Bond Markets
Like equities markets, global bond markets also continue to grow. In the U.S., total debt issued exceeds total equities by a relatively modest amount ($54.5 trillion vs. $50.7 trillion, respectively). But in other countries, bonds exceed equities by a much larger amount. Japan has $10.8 trillion in bonds and $4.9 trillion in equities. The U.K. holds $5.5 trillion in bonds and $2.85 trillion in equities. China is particularly skewed toward debt with $21.6 trillion in bonds vs. $1.9 trillion in equities.
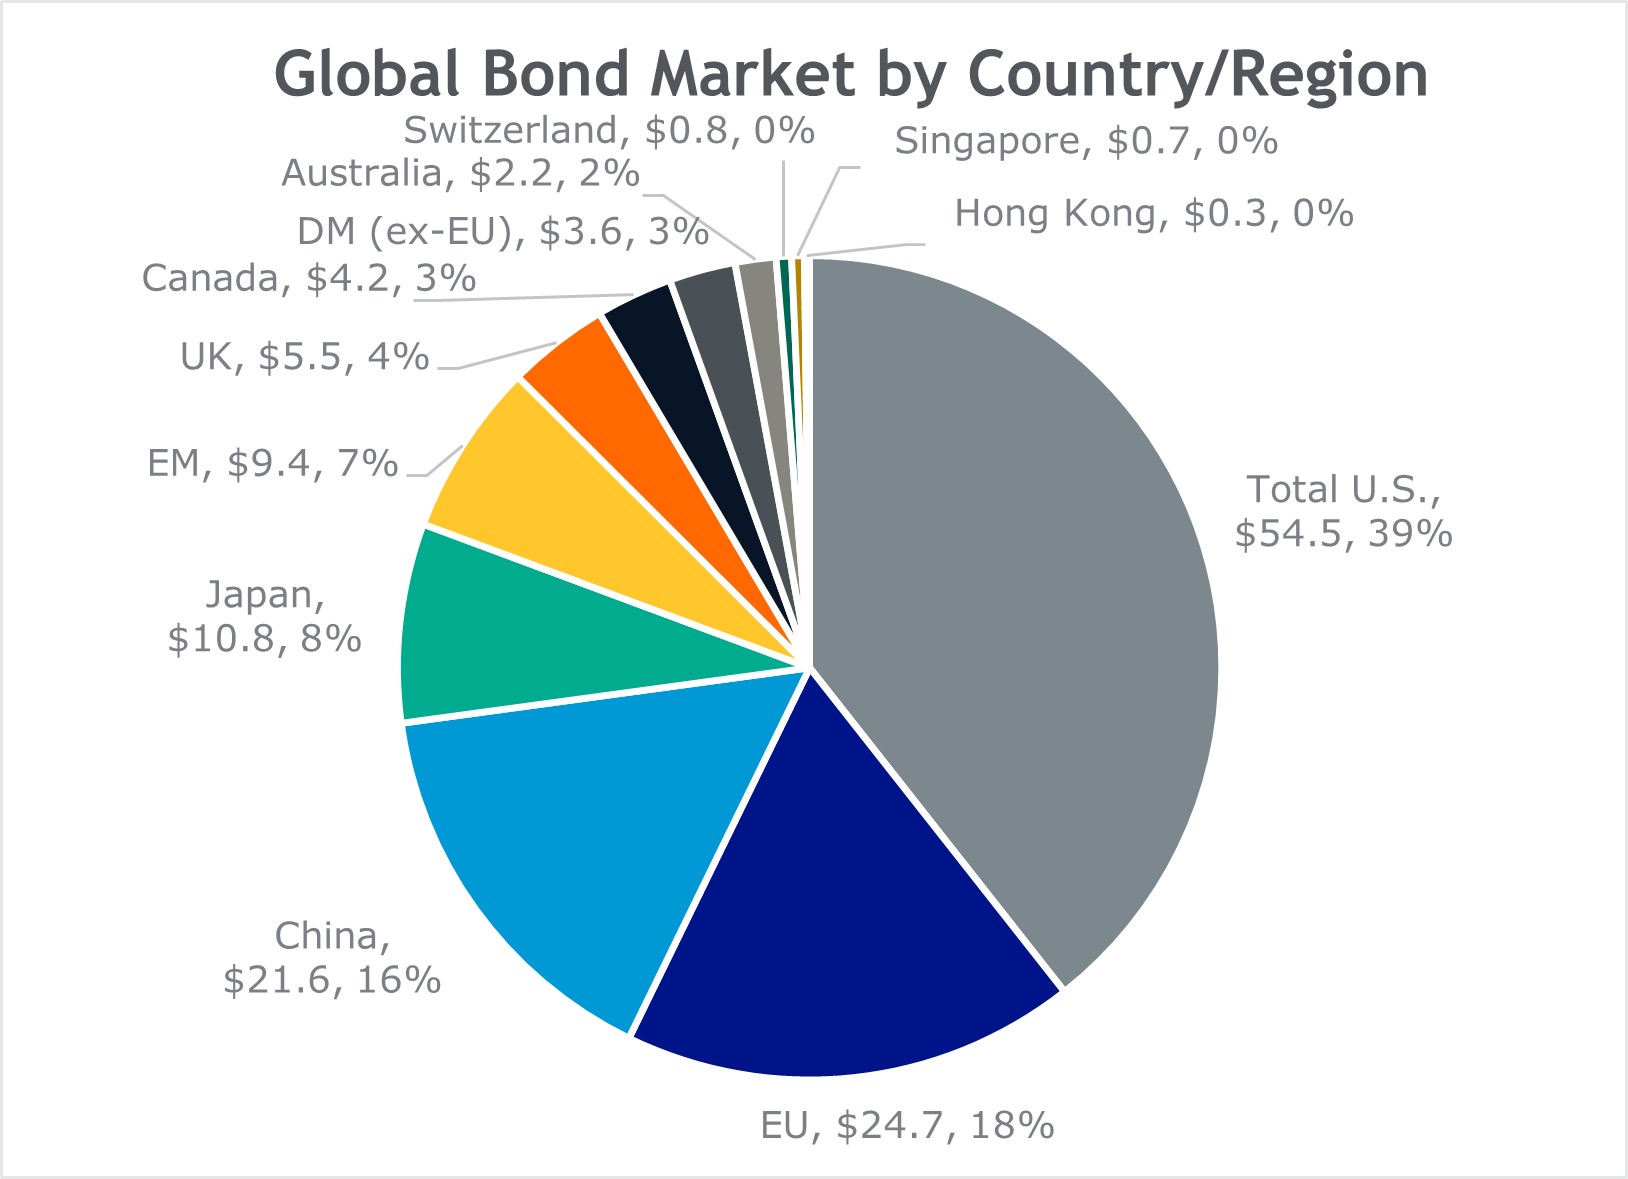
Source: SIFMA Quarterly Report: US Fixed Income 4Q2023 and SIFMA Factbook 2023. As of 12/31/2023.
In the U.S., the large size of the bond market allows for the development of unique sectors. The mortgage-backed securities (MBS) market grew and became a major source of funds to finance home ownership. Other securitized bonds have emerged, too. Asset-backed securities (ABS) are bonds that are collateralized by various assets such as loans, aircraft leases, and even credit card receivables. Corporate bonds are a key funding vehicle for U.S. corporations and important investments for individuals and institutions. Investment-grade and high-yield corporate markets are nearly $11 trillion in size combined.
Of course, we can’t forget about the U.S. Treasury market, the largest bond market in the world and arguably the most important. Treasury securities, net of intragovernmental holdings, are $26.4 trillion. The gross issuance is $34.5 trillion and growing daily as the government continues to run budget deficits. There has been innovation within the Treasury itself over the years, such as the introduction of Treasury Inflation Protected Securities (TIPS) in 1997. The principal of these securities adjusts for inflation to protect against its eroding effect; the interest rate, though fixed, is paid on the rising principal and, therefore, rises with inflation.
One caveat of solely relying on the market value of bonds to suggest allocation is that a large size may be the result of high debt levels. A review of credit quality and capacity to pay interest and principal are important. For instance, earlier we highlighted the Chinese debt of $21.6 trillion, above their gross domestic product (GDP) of $18.5 trillion. In the U.S., total debt is $54.5 trillion while GDP was $28.8 trillion. China’s ratio of debt to GDP was 117%, compared with 189% in the U.S. But digging further, we know that net U.S. Treasury debt was $26.4 trillion, making the ratio of net Treasury debt to GDP 92%.
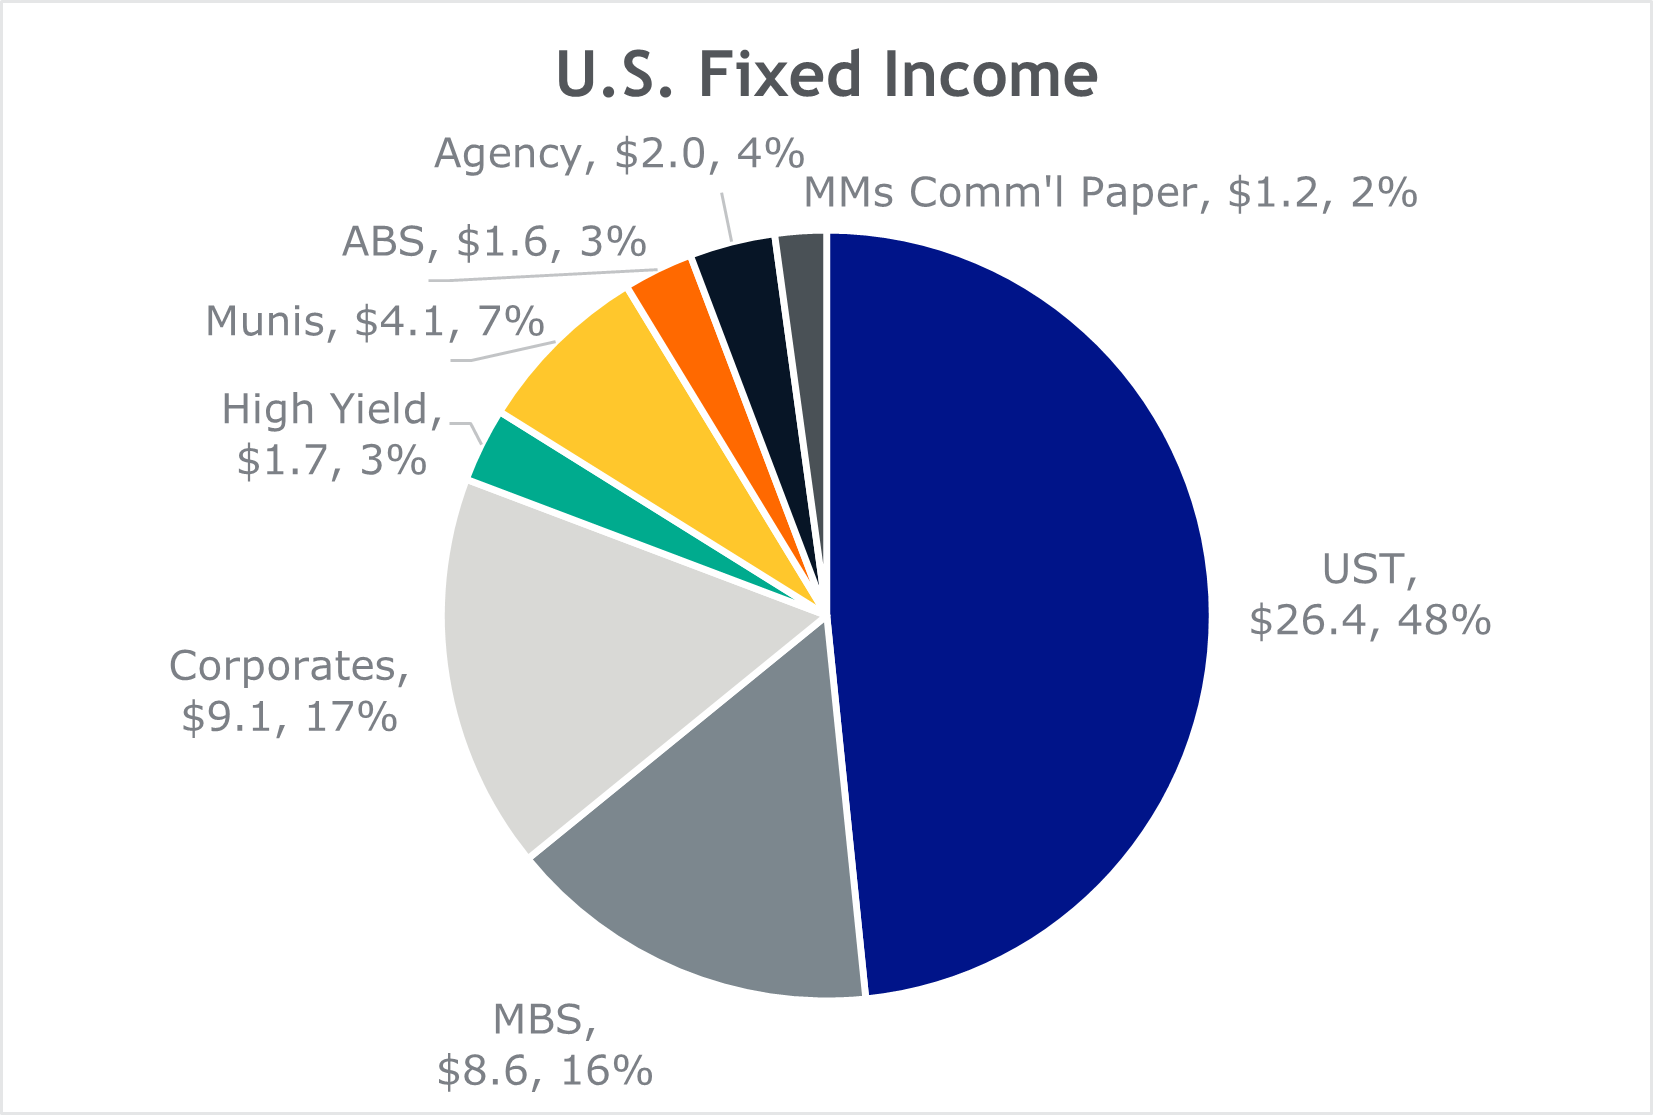
Source: SIFMA Quarterly Report: US Fixed Income 4Q2023 and SIFMA Factbook 2023. As of 12/31/2023.
Alternatives
Alternative investments can be defined partly by what they are not. They are not traditional, publicly traded stocks or bonds, though they can be linked to corporate balance sheets as private equity, venture capital, and private credit. Other alternatives reflect ownership of hard assets like private real estate, gold, and natural resources. We also include bitcoin, as its total value is above $1 trillion and is now available through ETFs.
While investing in alternatives has grown rapidly, the total is $20.9 trillion or slightly under 9% of all investable assets. Still, the alternatives market is significant. Private equity assets total $5.8 trillion, which is larger than the Japanese stock market (the second largest in the world). Private credit, which encompasses direct loans to corporations, is a $1.7 trillion market and is the same size as the U.S. high-yield bond market.
Innovation and human productivity have been clearly evident in alternatives. The very public nature of stocks, for better or worse, has encouraged the growth of private markets. Some companies can’t (or don’t want to) be subject to public scrutiny and seek capital in private markets, both equity and credit.
Growth in alternatives has transformed the market and now companies can stay private longer, depriving the public markets of newer and growing companies and encouraging investor dollars to flow to private investments. Providing access to private equity, credit, and real estate investments can improve the diversification profile for investors. However, it’s important to note there are risks to accessing alternative investments, due to less publicly available information, reduced liquidity, and higher fees.
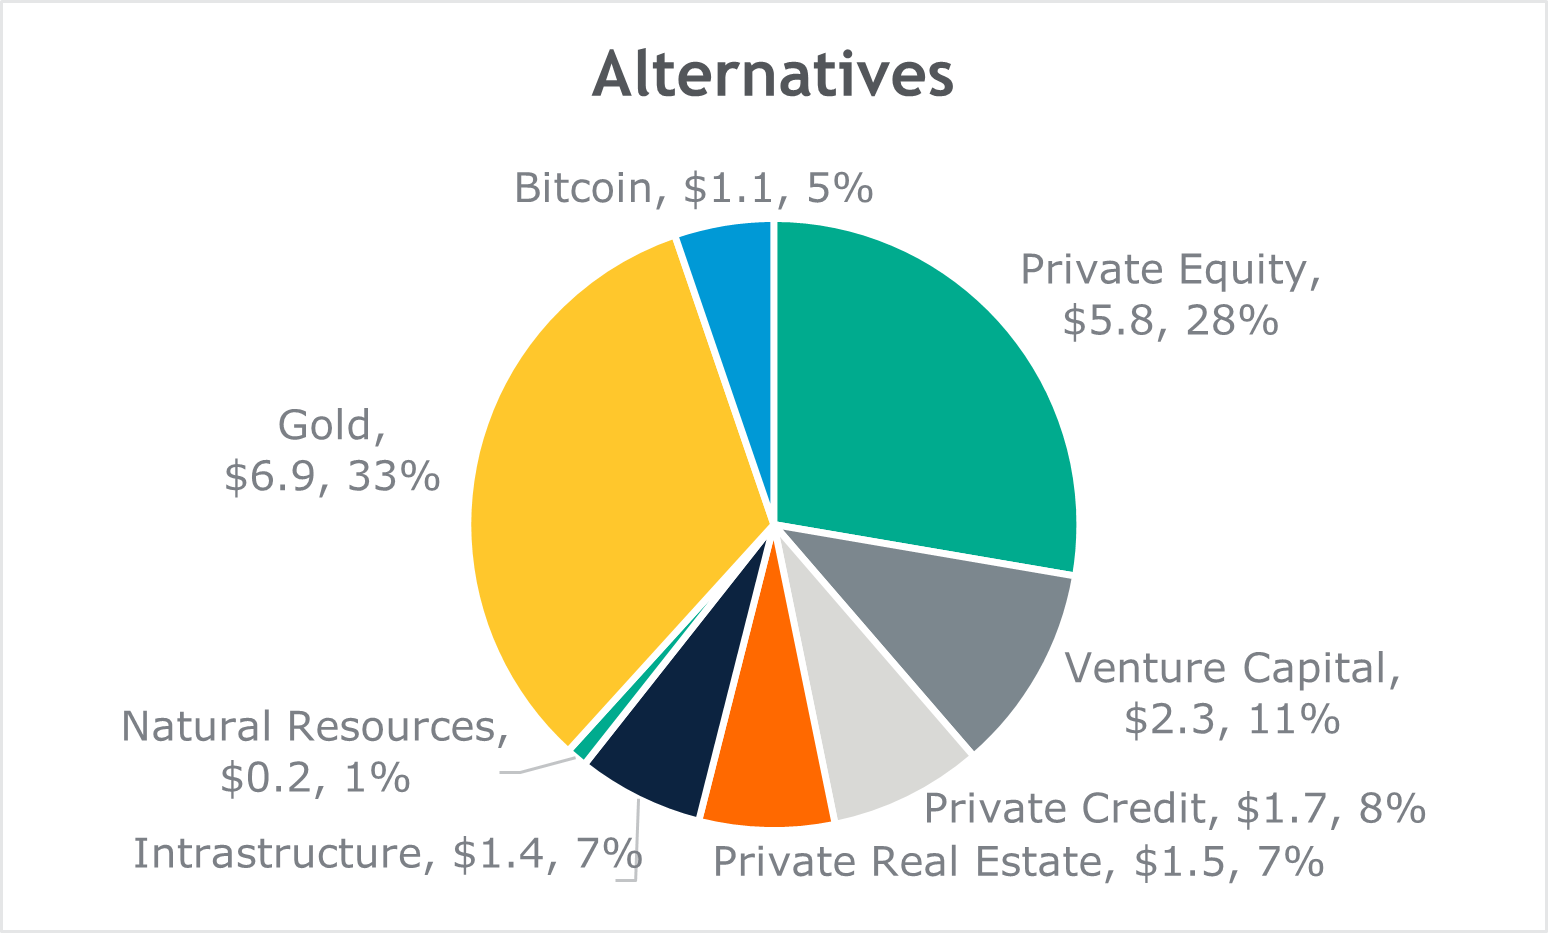
Source: Preqin, World Gold Council, Coinbase. As of 12/31/2023.
Summary
Opportunities for both individual and institutional investors continue to expand within and beyond traditional stocks and bonds. While the U.S. dominates both the stock and bond markets, key segments and companies scattered worldwide can add value for investors. With this in mind, we can use the global investable universe to show the relative significance of each asset class and use it as a baseline for building our own portfolios, especially as innovation and productivity introduce new opportunities―and risks―for investors.
Private funds are speculative investments and are not suitable for all investors, nor do they represent a complete investment program. Private funds are available only to qualified investors who are comfortable with the substantial risks associated with investing in private funds. An investment in a private fund includes the risks inherent in an investment in securities.
CAS00000147-05-24
Looking for personalized guidance?
Our advisors bring financial expertise and biblical wisdom together to guide the decisions shaping your future.