
U.S. vs. Emerging Markets: Comparing Performance Since the Global Financial Crisis
For more than a decade, U.S. stocks have essentially been the only game in town. Emerging markets (EM), such as China, India, and Mexico, have been left behind as the dominance of the “FAANG” stocks (an acronym representing Facebook, Apple, Amazon, Netflix, and Google) powered markets higher. A new group of stocks, dubbed the “Magnificent Seven,” consists of most of the FAANG stocks but also includes Microsoft and highfliers like Nvidia and Tesla. The top five companies by market capitalization now represent nearly 25% of the S&P 500.
Meanwhile, EM stocks have underperformed for years relative to the U.S. As a result, investors are reluctant to pare back U.S. equity exposure in their portfolios. In this article, we will examine the performance of U.S. and EM equities since the Global Financial Crisis (GFC) and highlight key drivers of performance, as well as potential challenges and tailwinds in the years ahead.
Post-GFC Boom
Since the stock market bottom after the Global Financial Crisis in March 2009, U.S. stocks have returned an impressive 16% annually, well above the 30-year average of about 10%. Over the same time period, EM returned about 6.6% annually.
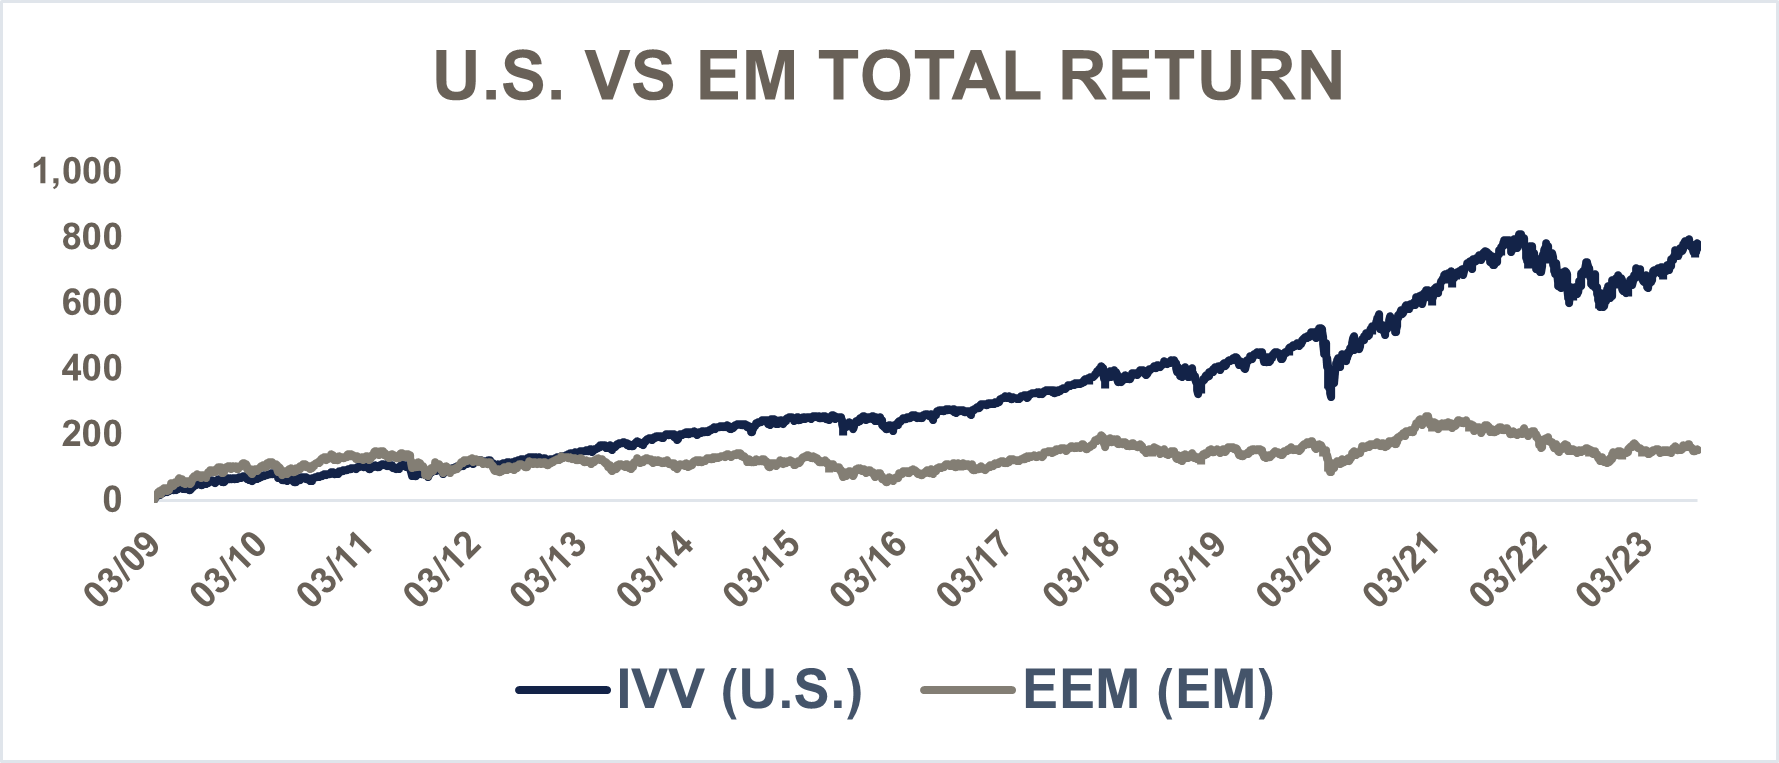
Source: FactSet
Emerging markets are responsible for about 45% of global gross domestic product (GDP) but comprise just 27% of global market capitalization.1 Typical characteristics of EM include low per capita income and financial markets that are less liquid relative to developed economies. They are typically less developed economies transitioning to more modern, industrial economies. If successful, this transition will result in trustworthy financial institutions, more liquid capital markets, and a more stable political environment. Additionally, young, fast-growing populations with higher expected GDP growth than developed economies like the U.S. typically characterize these economies. The chart below shows the estimated real GDP growth for the five largest components of the iShares MSCI Emerging Markets ETF (Brazil, China, India, South Korea, and Taiwan) relative to the U.S. and EM.
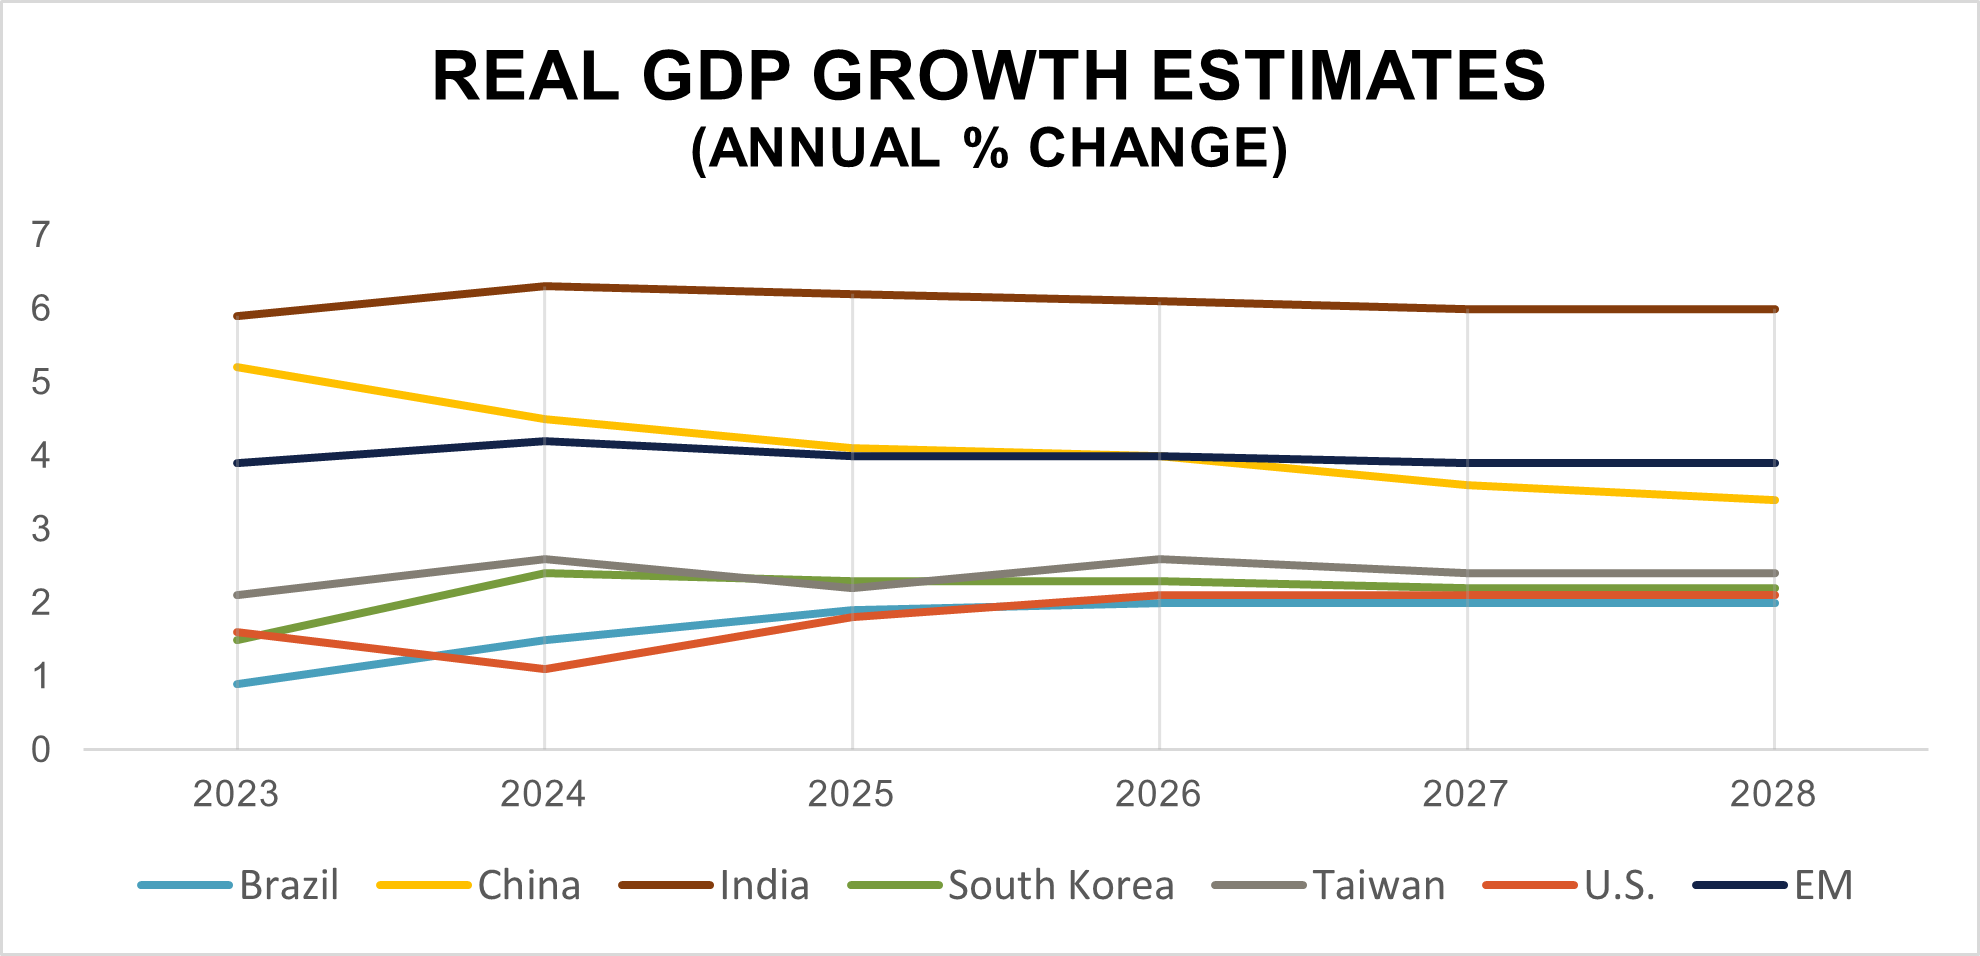
Source: International Monetary Fund and World Economic Outlook (April 2023)
Asia’s Influence
Since 2009, Asia Pacific’s weight has grown from 55% to 78% of the MSCI Emerging Markets Index. At 27% of the index, China currently has the most significant influence, but that’s down from 41% in September 2020.
As the primary component of the index, China will likely be the primary driver of EM performance in the years ahead. However, as the weights in the index shift over time, China’s influence could decrease as other countries grow. In 1992, for instance, Mexico was the largest component of the MSCI EM benchmark, representing 26% of the index, but today it represents just under 3% of the index. At Blue Trust, we diversify exposure in emerging markets by utilizing funds that increase country diversification compared to the benchmark index.
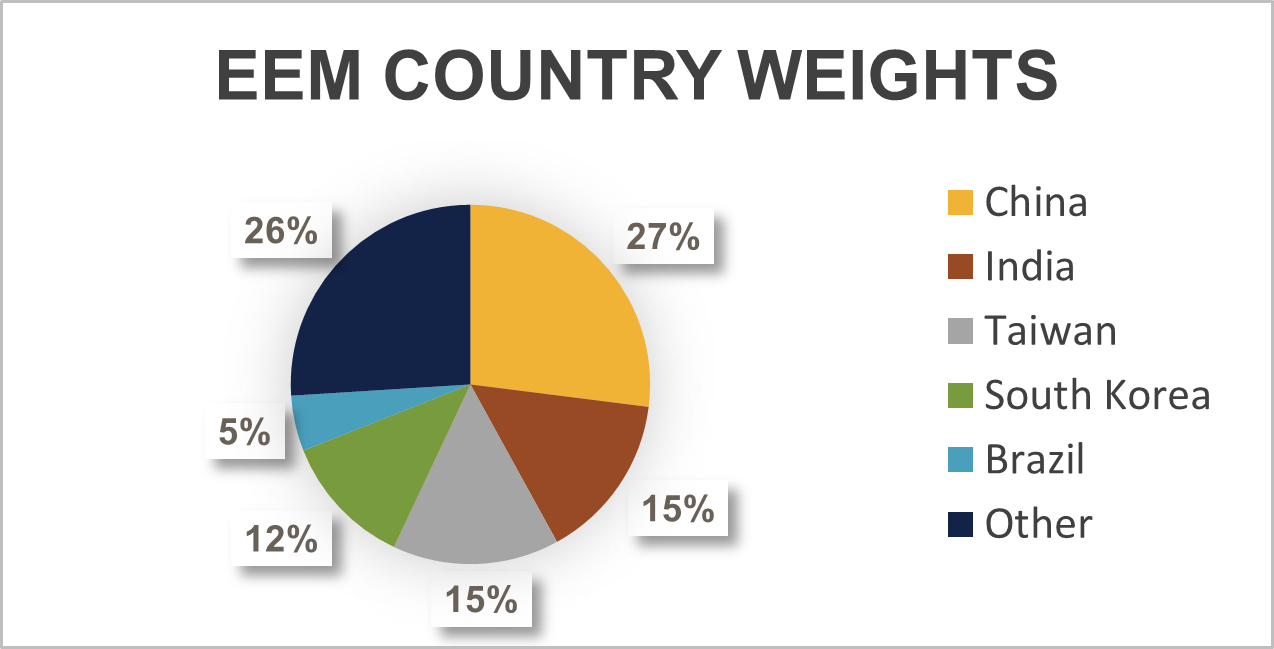
Source: FactSet. As of 9/30/2023.
China has been slow to rebound post-Covid. Excluding 2020, China’s 3% GDP growth in 2022 was the lowest since 1990, the year after the Tiananmen Square massacre. The country is facing multiple headwinds, including a property sector under stress and youth unemployment of over 21%.2 Additionally, decades of the “one-child policy” have resulted in a rapidly aging population. By 2040, experts estimate that 32% of China’s population will be over age 60, up from just under 18% in 2020.3 An aging population and a decline in younger, more productive workers is not a recipe for expansion, as the primary drivers of growth include increases in the labor force and productivity. However, China could overcome these obstacles if its birth rate increases, or new technologies (like AI) reaccelerate their growth.
If China does endure a period of underperformance, other emerging economies, such as Mexico, will benefit from the diversification of global supply chains, as the chart below shows. Supply constraints during the pandemic highlighted the risk of concentrating production in China. U.S./China tensions have also accelerated a shift toward bringing production closer to home or relocating it to more congenial countries, policies termed “nearshoring” and “friend-shoring,” respectively.
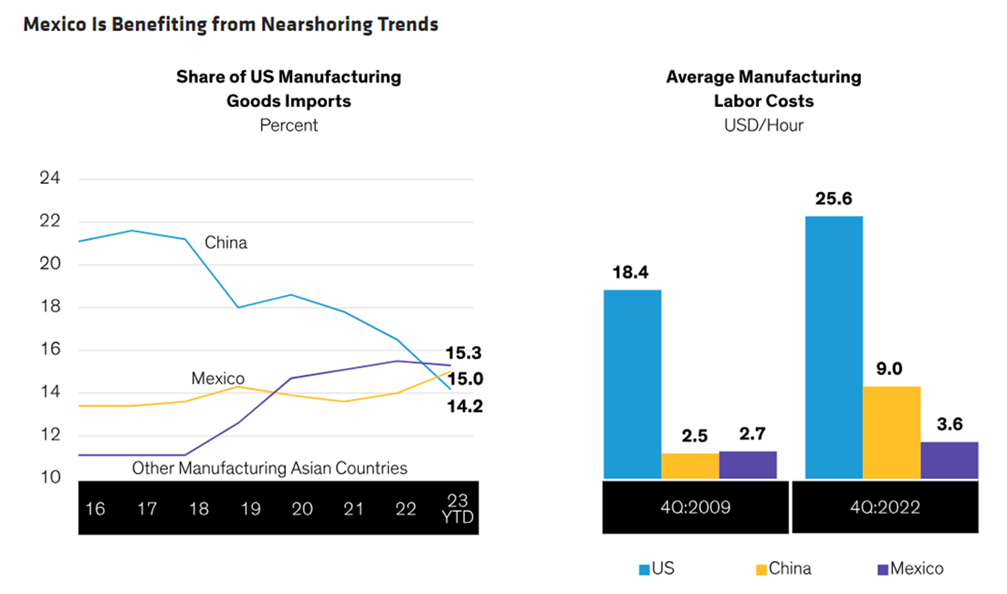
Source: AllianceBernstein. Chart Source: Bureau of Economic Analysis, Morgan Stanley, Refinitiv, and Santander. As of 03/31/2023.
U.S. Dollar Strength
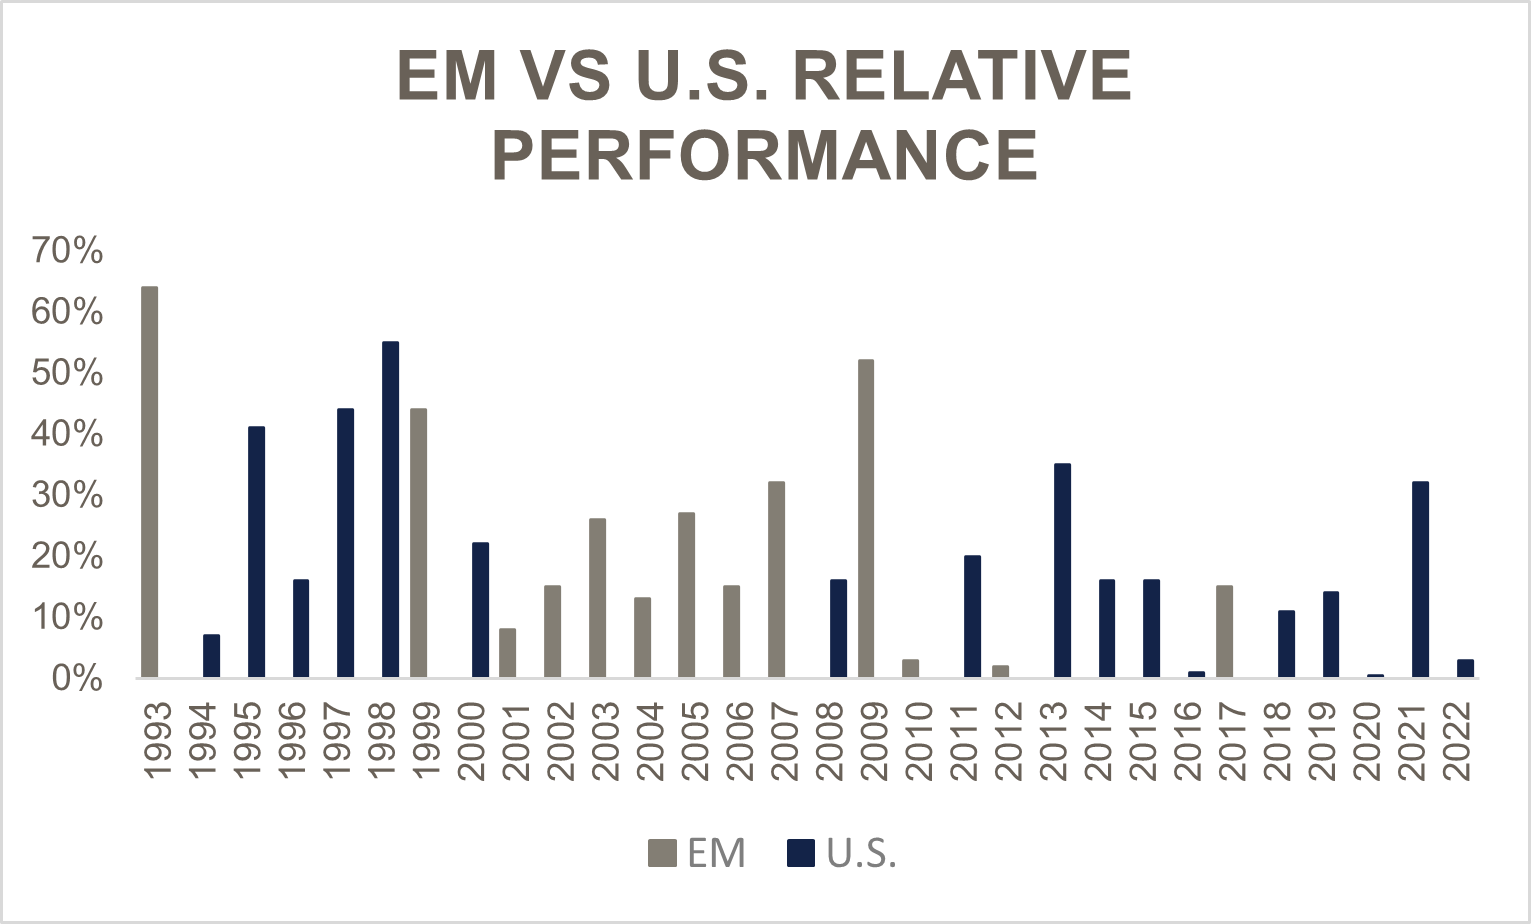
A strong U.S. dollar (USD) is one factor that has contributed to EM underperformance. Since the GFC, the USD has shown little weakness. As EM currencies weaken against the USD, these countries cannot import the same amount of U.S. goods and services. As imports become more expensive, these higher costs hinder investment and growth in EM economies. Conversely, a weaker dollar would allow countries to purchase more goods and services as their currencies strengthen against the USD. Some EM countries also hold dollar-denominated debt, meaning they must pay back their debt in dollars. As their currencies weaken against the dollar, the debt burden becomes greater in local currency terms. When the dollar is weak relative to EM currencies, EM countries can borrow money cheaply to finance domestic growth initiatives. This process should lead to a higher per capita income, which should lead to growth in spending and an increase in earnings for companies, ultimately leading to a stronger stock market. Most recently, EM had a robust period of relative outperformance from 2001 – 2007, the last sustained period of dollar weakness.
Source: FactSet
Earnings Growth and Multiple Expansion
Earnings growth and multiple expansion are two additional factors that have impacted EM performance relative to the U.S. Over the long term, many people view earnings as the greatest driver of stock market returns. Since the market bottom in 2009, the compound annual growth rate of USD earnings in the U.S. has been 9.8%, but just 1.9% in EM. However, a major reason for EM’s low earnings growth during this period was the strength of the USD. Since 2009, major EM currencies have been anywhere from flat to down more than 50% relative to the USD.
Moreover, investors have also been willing to pay more for U.S. earnings as the gap between U.S. and EM price-to-earnings (PE) ratios has expanded. The PE ratio reflects what investors are willing to pay for a company’s earnings and is influenced by investor emotions, reaching higher values (multiple expansion) during periods of optimism, and lower values (multiple contraction) during periods of pessimism.
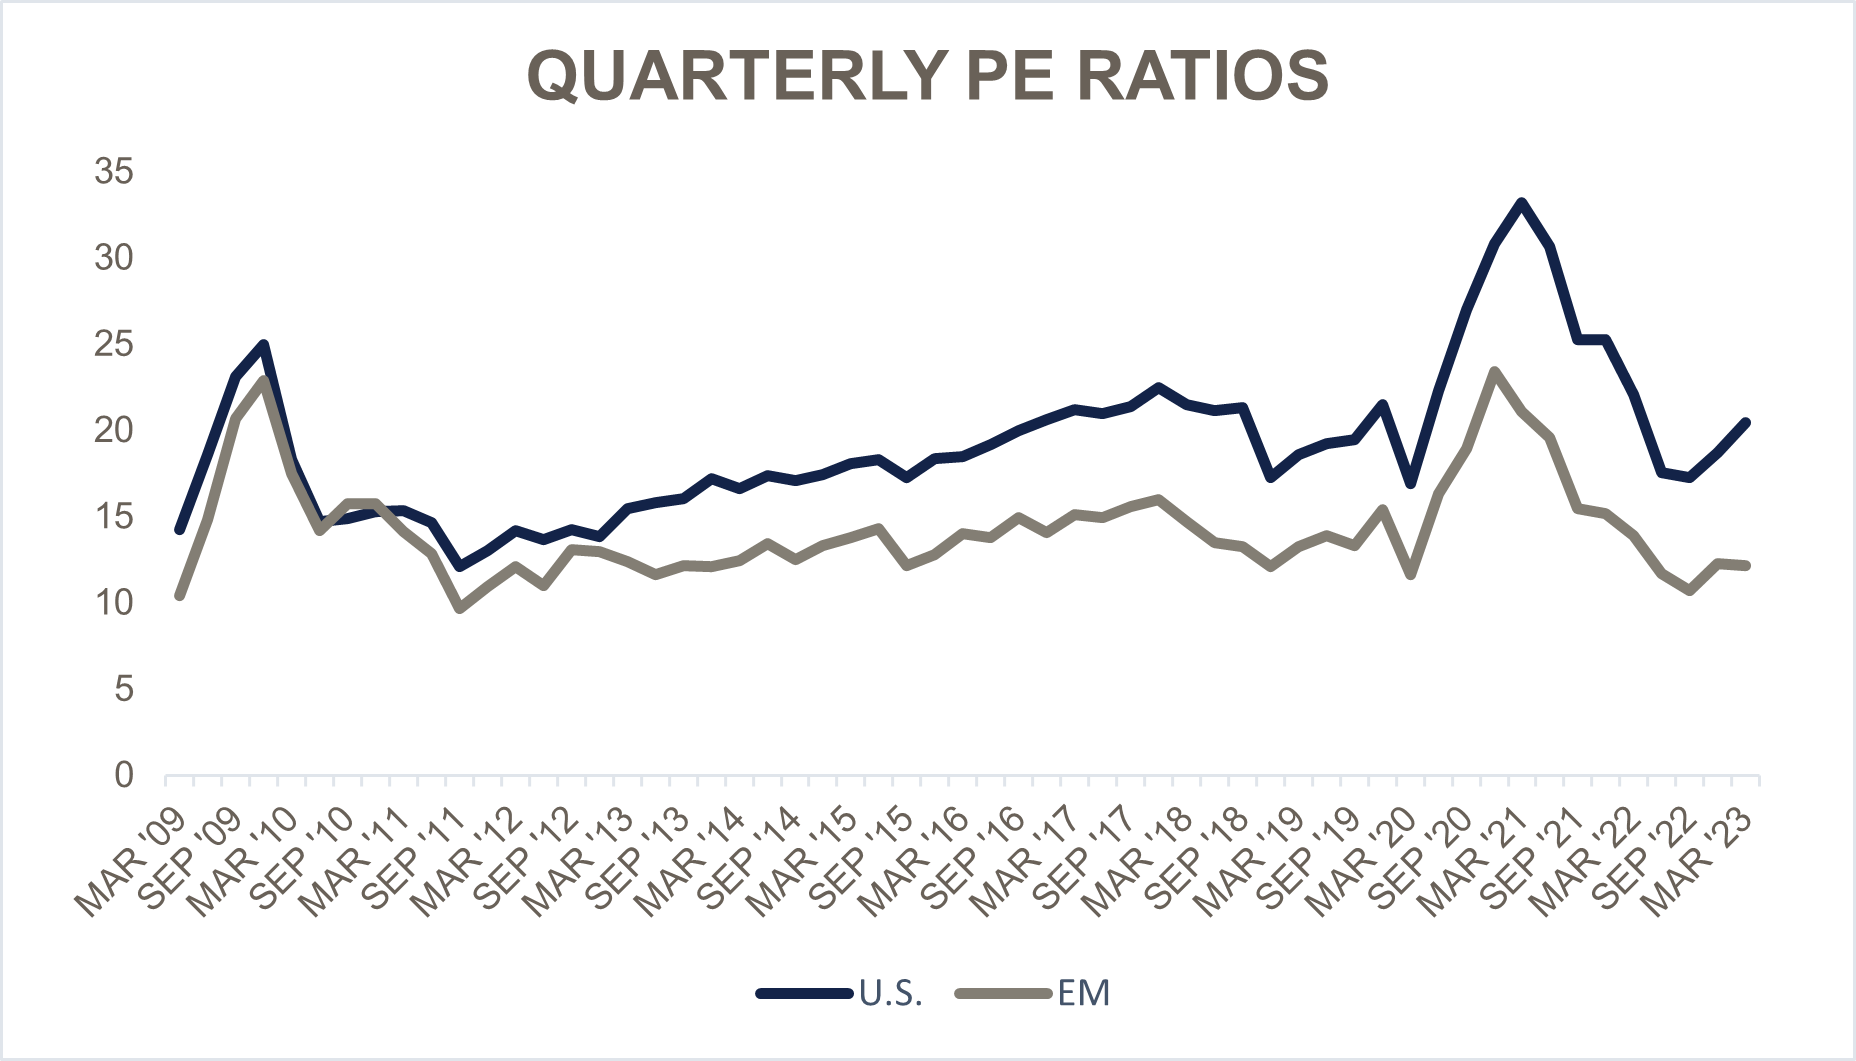
Source: FactSet
With such a contrast in USD earnings growth, it should come as no surprise that U.S. markets have outperformed EM. When times are good, investors may continue to bid up stock prices, believing that good performance will continue. The fear of missing out (FOMO) can drive investors to buy into stocks at any price. Similarly, investors may sell already cheap assets expecting underperformance to continue. This behavior may continue as investors wait for obvious evidence that contradicts their beliefs.
Some may point to U.S. earnings growth being somewhat inflated due to the massive number of buybacks that have taken place since the GFC—a practice mostly seen in the U.S. A buyback involves a company using excess cash to repurchase its shares from investors. This action decreases the amount of shares outstanding, thus increasing the company’s earnings per share. Companies often use buybacks to offset dilution resulting from stock-based compensation or when they cannot identify productive projects or investments. Between 2010 and 2019, U.S. firms completed a net $4 trillion in buybacks.4 Buybacks increase the value of the remaining shares, giving investors more ownership and entitling them to greater dividends in the future.
Other factors an investor might consider are ratios like return on equity (ROE), which helps an investor gauge a firm’s efficiency in generating profits. Since the GFC, ROE has increased in the U.S. and decreased in EM. Some contributing factors to this phenomenon include access to historically cheap debt, reduced corporate tax rates, and monopoly-like tech giants that can demand premium prices and reap the benefits of higher margins and net income. The potential for mean reversion in interest rates, higher corporate tax rates, and increasing scrutiny on tech companies in the U.S. could lead to a stalling or reversal of this trend.
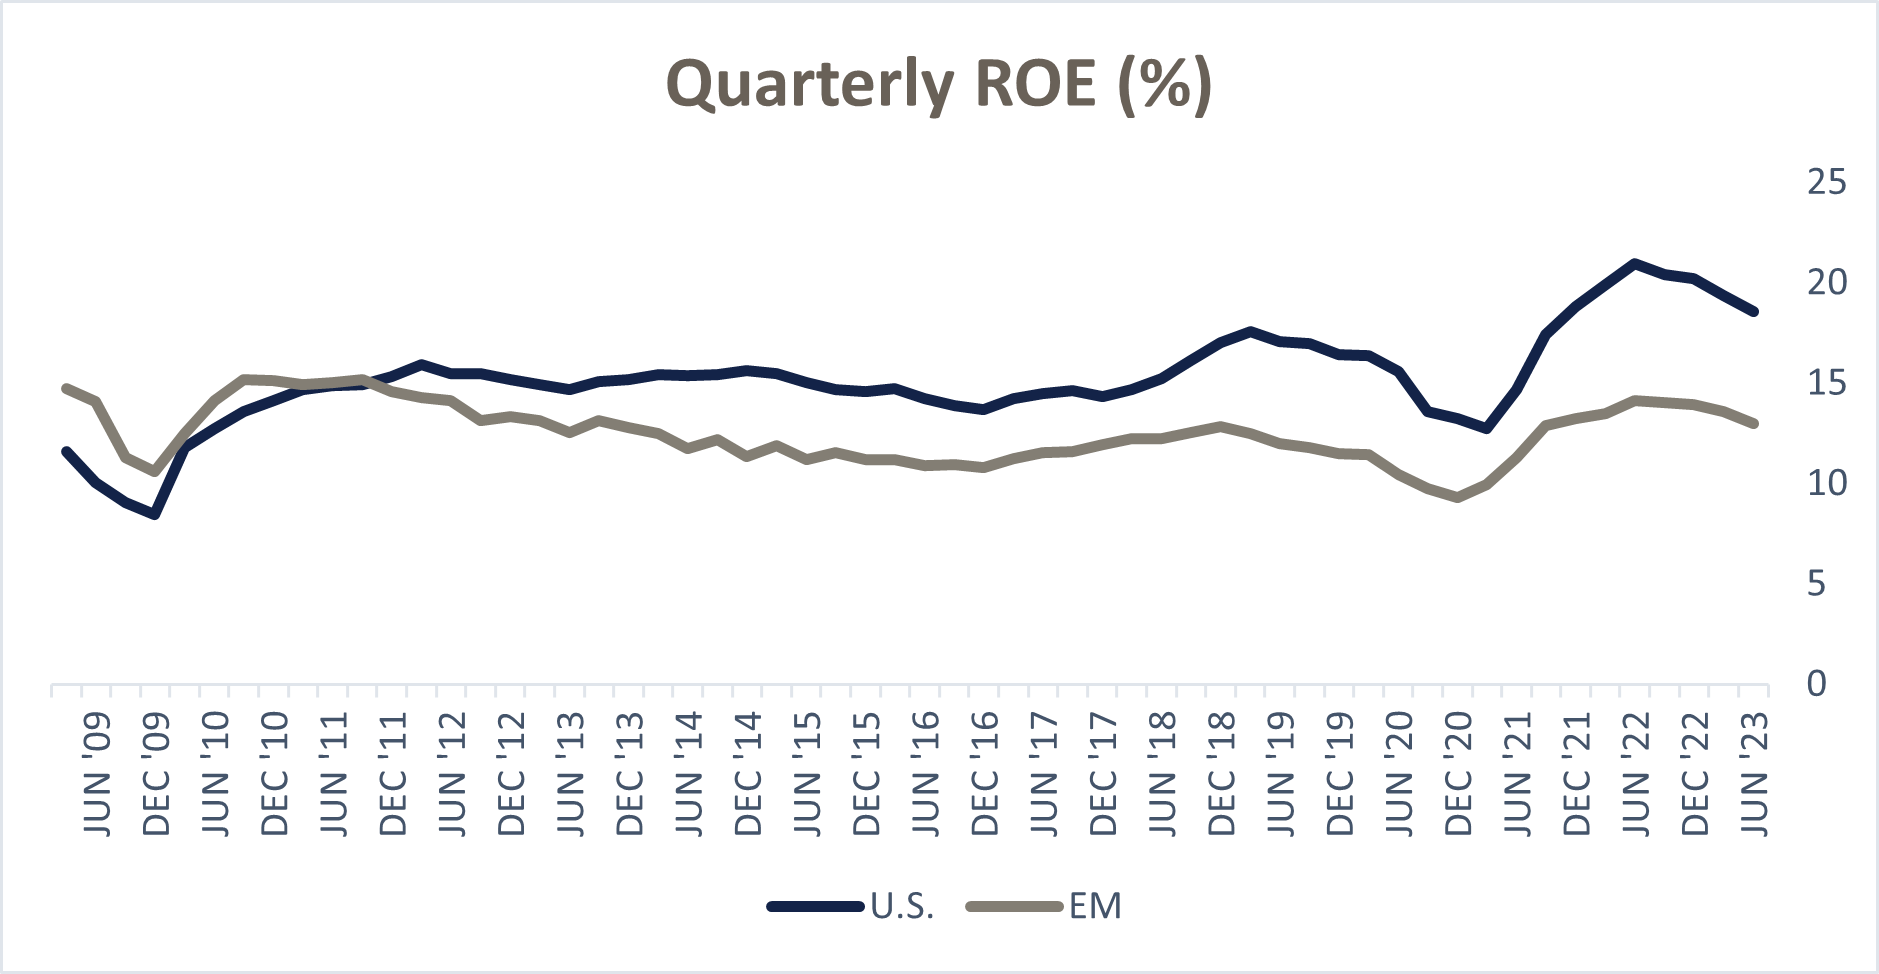
Source: FactSet
The Importance of Diversification
Regardless of what lies ahead, history shows that diversification is vital. Outperformance tends to come in cycles, and periods of below-average returns often follow periods of excess returns. In the future, EM could be more diversifying than usual as the world becomes more bipolar with the East and West decoupling. U.S. investors have enjoyed more than a decade of above-average returns, so caution may be warranted.
Japan is one of the most famous example of the dangers of concentration, as investors that remained primarily invested in the Nikkei 225 Index waited 33 years before revisiting old highs earlier this year. This example doesn’t mean that investors will have to endure a market downturn, but recent returns may portend an extended period of lackluster stock market returns in the future.
Conclusion
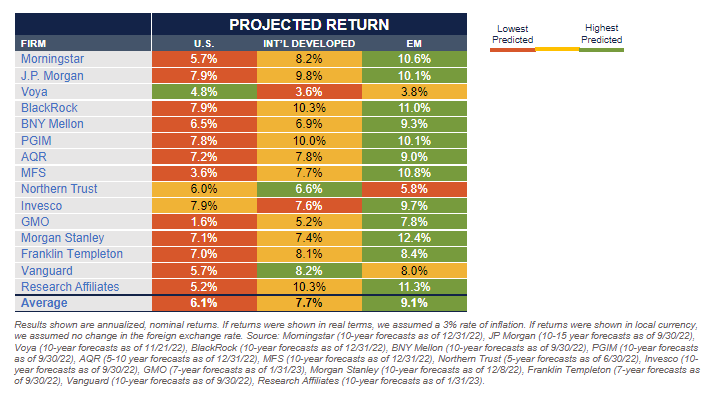
Perhaps the most significant risk facing emerging markets is geopolitical turmoil in Asia, as any disruption triggered by a conflict would present obstacles to EM performance. Still, there are reasons to be optimistic on EM, including potential USD depreciation, relative valuation mean reversion, and faster GDP growth. New technologies, like AI, could also boost productivity and unleash EM growth potential. A global shift toward electric vehicles (EV) and massive “green revolution” spending should directly benefit EM economies since they are the primary producers of the key inputs needed for EV production and the clean energy transition. The chart below shows that most firms agree and point to EM as having the highest projected return over the next 5-15 years.
Emerging markets play a critical role in a diversified portfolio by potentially providing outperformance when the U.S. stock market experiences weakness. However, the best portfolio is one that an investor can stick with, which is why it’s important to create an investment plan based on one’s personal time horizons and preferences. At Blue Trust, we believe EM can provide diversification benefits to help investors achieve their goals. Although recent performance has been disappointing, periods such as the 2000s show how EM can serve as a welcome diversifier during periods of U.S. underperformance.