The World is Your Oyster. So Where Are the Pearls?
In the first quarter of 2024, U.S. stocks outperformed global equities, as well as their developed- and emerging-markets (EM) peers. The same was true in 2023. In fact, the U.S. run of dominance dates back to the global financial crisis of 2007-09 and even longer, back to the early 1990s. This performance has been wonderful news for U.S. investors. However, it also provides the potential for some investors to get tunnel vision or confirmation bias―when individuals remember or favor information that confirms their existing beliefs. Lisa Shalett, chief investment officer at Morgan Stanley Wealth Management, wrote in a February note to clients, “The S&P 500’s extraordinary outperformance of nonU.S. stocks over the past 15 years has convinced many investors that the U.S. is the only game in town.”
It’s not, of course. At Blue Trust, we believe a global viewpoint is worth highlighting in today’s investing climate. Although the U.S. has an impressive growth orientation and track record, the sheer size, high profitability, and quality of some of the world’s largest non-U.S. companies offer great international opportunities. Our investment process rests on the pillars of growth, value, and diversification. Global economic growth, led by EM economies, is expected to be stronger than in the U.S. over the next 10 years, and we believe investors should consider adding exposure to that growth. After the long string of U.S. market outperformance, the relative valuation spread between the U.S. and the rest of the globe is at historic highs. History tells us that portfolio diversification helps reduce risk and improve the odds of meeting investors’ cash flow needs in the long term. Although the U.S. dominance is striking in depth and duration, trends—even compelling, longrunning ones—tend to even out over time.
Trust and investment management accounts and services offered by Blue Trust, Inc. are not insured by the FDIC or any other federal government agency, are not deposits or other obligations of, nor guaranteed by any bank or bank affiliate, and are subject to investment risk, including possible loss of the principal amount invested. Blue Trust is a Tennessee chartered public trust company.
Economic Overview
U.S. Stocks Account for Two-Thirds of Global Market
Key U.S. equity indexes reached multiple all-time highs in early 2024, continuing the run-up that drove U.S. stocks’ weighting in the MSCI All Country World Index (ACWI), a noted measure of the global market. The U.S.’s percentage of the index has climbed steadily over the years, up from just 29% in the late 1980s to approximately 42% in 2011, to now nearly two-thirds. The ACWI also closed the first quarter near an all-time high, with a gain of 7.8%. One key index that didn’t reach new records was the ACWI ex-USA, which covers the rest of the world aside from the U.S. It posted a quarterly return of 4.4%—after trailing the full ACWI by nearly 7% in 2023. However, like the S&P 500, the ACWI ex-USA index is home to some of the world’s best companies.
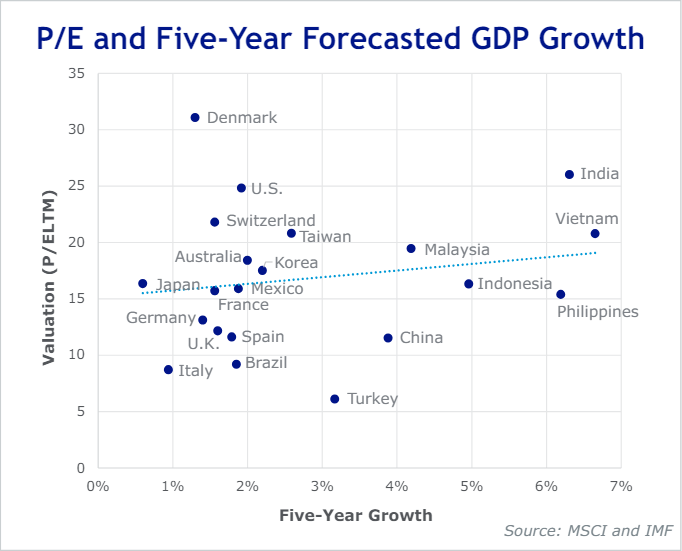
At the end of February, the forward price-to-earnings (P/E) multiple for the S&P 500 stood at 21.17, with an indicated dividend yield of 1.44%. That compared to the ACWI ex-USA P/E of 13.27, with a yield of 2.98%. The P/E spread was at a 20-plus-year high of nearly 35%.
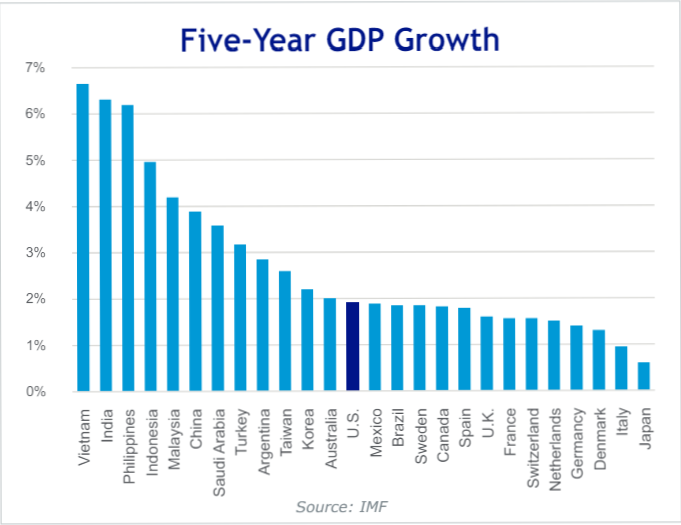
As for economic growth, a host of EM countries have outpaced the U.S. in recent years and are forecast to continue that trend. In this recent piece, we dove deeper into EM, noting that the group recently accounted for about 45% of global gross domestic product (GDP) but just 11% of global market capitalization. While the U.S. made up nearly two-thirds of the global market cap, its share of global GDP stood near 25%. Despite the good relative growth and smaller footprint, EM markets have underperformed the U.S. Strong economic growth doesn’t always translate to superior earnings or stock price gains. A combination of strong institutions, property rights, shareholder-friendly policies, and even demographics favor the U.S. over many, but not all, countries.
What’s in the Other Third? And Does it Matter?
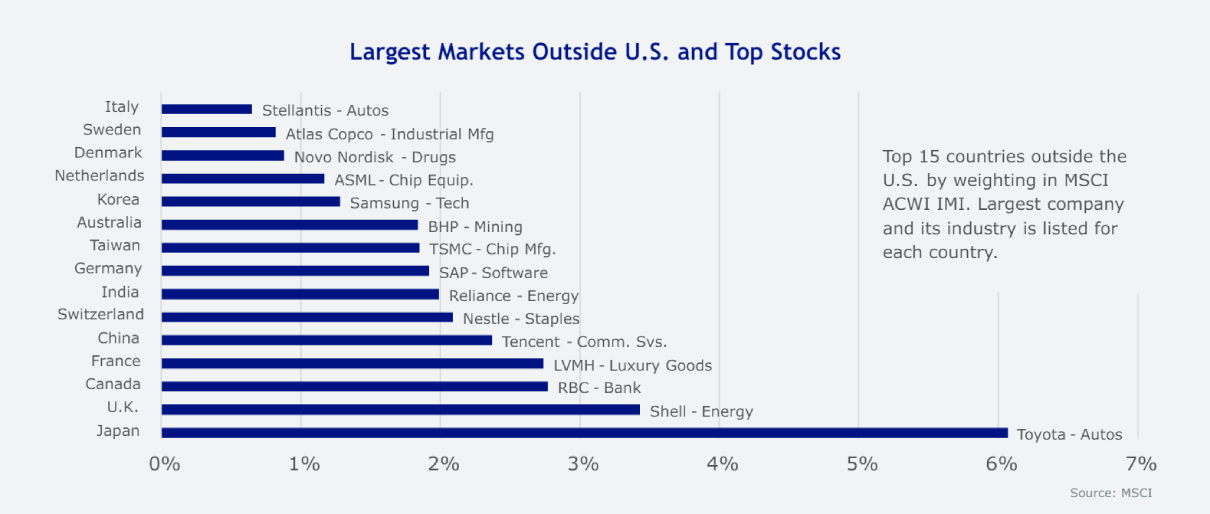
If U.S. stocks make up two-thirds of the world’s market cap, what is happening in the rest of the world? Given the U.S. market’s growth orientation and scope, as well as the profitability and quality of some of the world’s largest companies, U.S. stocks tend to trade at a premium compared to international equities. However, the long period of U.S. dominance has pushed its valuations much higher than we’ve seen recently. That’s not to suggest that the U.S. market is in a bubble or ready to burst. However, it does indicate that non-U.S. stocks may present a better value, which underlines our belief that investing opportunities for equities are much larger than just the U.S. market.
Investment Implications: Our disciplined investment process continually weighs the growth versus valuation fulcrum and suggests that with high U.S. valuations and growth opportunities elsewhere, diversifying beyond U.S. stocks is wise in the current environment. The biggest stock story of the last year– plus is arguably the inexorable rise of artificial intelligence (AI) bellwether NVIDIA. Taiwan-based TSMC, whose shares have rallied but at a much slower pace, counts both NVIDIA and Apple among its largest clients. Dutch firm ASML supplies NVIDIA with its advanced chipmaking equipment. Together, these two firms are essential to NVIDIA’s success.
Other examples include Korea’s Samsung, which is known as a popular consumer-electronics manufacturer but is also an important maker of semiconductors and memory chips. Eli Lilly has become one of the poster children for the long-running surge in obesity-treatment medications, but Denmark-based Novo Nordisk makes the increasingly popular weight-loss drugs Ozempic and Wegovy. Japan’s Toyota ranks as the world’s largest automaker by volume, with a dominant position in hybrid technology. There are hundreds, if not thousands, of non-U.S. stocks with similar dynamics across developed and emerging markets. Importantly, these large multinational companies share many of the same characteristics as U.S. companies. They compete worldwide, are innovative, obtain top talent, and use the same shareholderfriendly decisions as U.S. companies.
Japan: Land Of The Rising Stocks (and the Falling Yen)
For the first time in 34 years, Japan’s price-weighted Nikkei 225 Index reached a series of record highs during the last quarter. The index’s 1989 peak turned out to be a speculation-fueled bubble about to burst, as the index fell nearly 60% in two-plus years and didn’t truly bottom out until 2009―nearly 80% below the record high―as Japan’s economy sputtered relative to the rest of the world for three decades. The Nikkei 225 advanced 21.5% last quarter, while the market cap–weighted Tokyo Stock Price Index (TOPIX) was up 18.1%. These increases occurred despite the Japanese economy contracting during last year’s third quarter and barely avoiding a second consecutive quarterly downturn when the fourth-quarter GDP results were revised slightly into positive territory. Japanese stocks have broadly kept pace with U.S. equities since the start of 2022. The Japanese yen has been weak since the pandemic, reaching multiyear lows, which has boosted Japanese firms’ earnings. Meanwhile, the Bank of Japan (BOJ) raised its benchmark overnight interest rate in March for the first time in 17 years, ending a long run of negative rates, which combined with other easy monetary policy measures to support the economy after several decades of relatively sluggish growth.
Japan Focuses on Shareholder Value
In addition to pulling out of three-plus decades of sluggish performance, the Tokyo Stock Exchange (TSE) has created a wide-ranging set of incentives to improve corporate governance, boost capital efficiency and return on equity (ROE), raise price-tobook (P/B) valuations, and generally improve shareholder value. Although many experts attribute the market’s resurgence to a global reallocation away from China, these and other regulatory reforms have also helped. At the end of 2023, 44% of TSE-listed companies had a P/B ratio below one (meaning their market value is less than the value of their net assets). In the S&P 500, the corresponding number is approximately 5%. Some 40% of TSE companies have an ROE below 8% versus about 14% in the U.S. benchmark. Japanese companies are adhering to the directives with 49% of TSE Prime Market Companies either already disclosing the reform initiatives or considering them as of December 2023. In July 2023, the number was only 31%.
Investment Implications: There could be much more shareholder value—and potential stock market gains—to come in Japan, and it may be time for U.S. investors to stop ignoring (or raise their exposure to) the world’s second-largest stock market. One of the goals of the TSE’s efforts is to raise the number of domestic retail investors in Japanese stocks, which, according to Goldman Sachs, recently sat at 11% versus 20% in Europe and 40% in the U.S.
While the weak yen may offset some gains for U.S. investors, policymakers are under pressure to increase the currency’s value to help improve consumers’ purchasing power and the value of the country’s exports. The BOJ’s rate pivot may represent an early sign of those efforts. Interestingly, while Japan’s market reforms still have ground to make up, progress has been impressive enough that South Korean regulators are planning a similar program.
Nearshoring Creates Opportunities
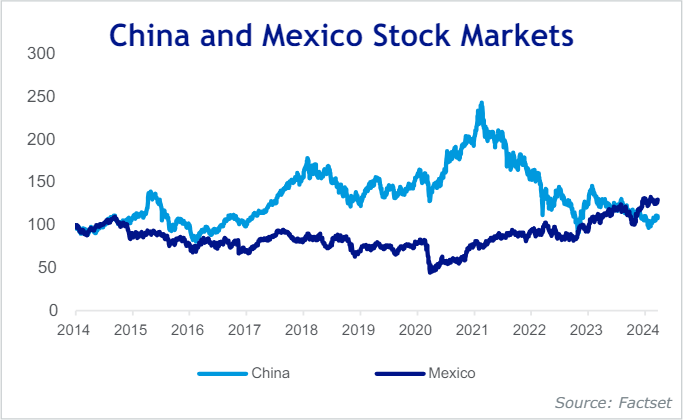
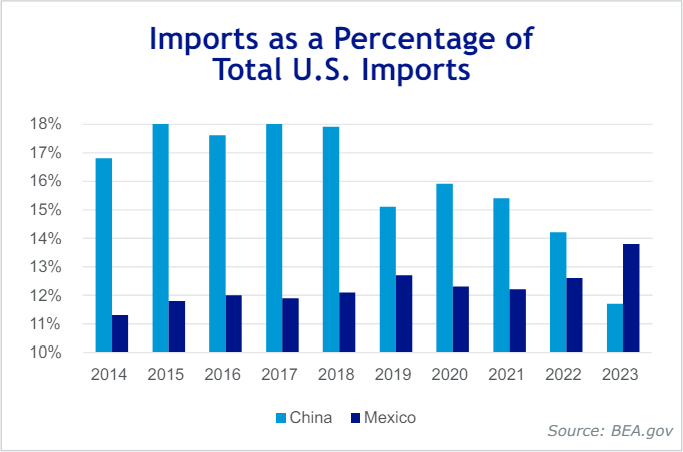
In 2023, Mexico became the U.S.’s biggest trade partner, surpassing China for the first time in 20 years, according to the U.S. Department of Commerce. Mexican stocks declined modestly during the first quarter, but their three-year return (as measured by the MSCI Mexico Index) ranks among the top performers across EM. Since the pandemic, and amid increasing geopolitical tensions and regional wars, companies in many developed markets have started to reshape global supply chains. For instance, some countries have moved operations back home (onshoring) or to neighboring and/or politically aligned countries (“friend-shoring”) or, in the case of companies looking to diversify supply chains away from China, “China plus one (or many).” Mexico’s proximity to the U.S., a strong manufacturing base, an ample supply of skilled workers, and free-trade agreements have helped the country increase its U.S. exports and the Mexican market’s exposure to U.S. growth.
The Beneficiaries of Changing Supply Chains
Mexico’s economy has benefited from nearshoring activity, attracting both new international investment and reinvestment by those already operating there. Mexico, aided in the 1990s by the North American Free Trade Agreement (NAFTA), more than doubled its exports to the U.S. and Canada from 1993 to 2002, when trade with NAFTA partners rose from 25% of the country’s GDP to 51%.
NAFTA’s 2020 successor, the United States–Mexico-Canada Agreement, combined with pandemic supply-change adjustments, has also helped Mexico, but the country is not alone. Over the last 10 years, countries in Asia (i.e., Vietnam, Thailand, and India) and Europe (i.e., Poland, Turkey, and Slovakia) have increased exports to the U.S., while Chinese imports have declined. Interestingly, China appears to be investing in Mexican manufacturing to benefit from this trend too. This shifting of production creates opportunities for some countries (while potentially negatively affecting others), thus creating new investment opportunities.
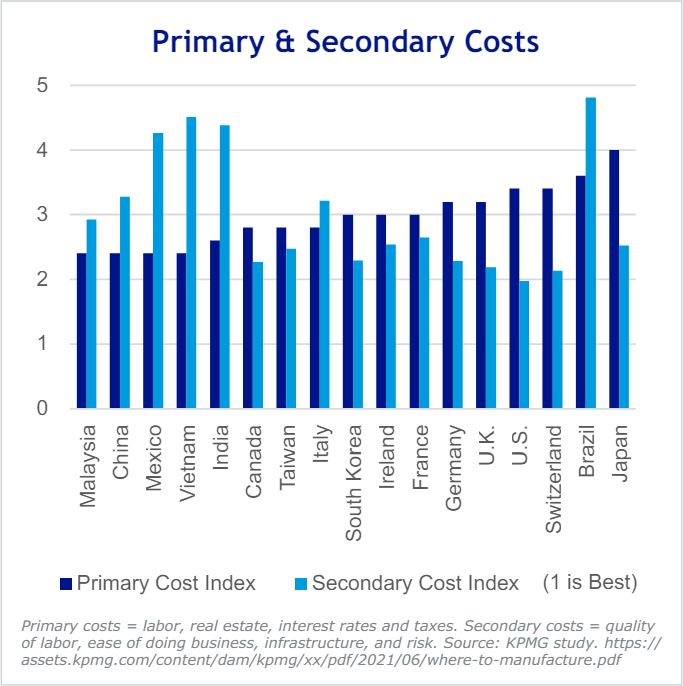
Investment Implications: Finding those opportunities is a much more detailed process than choosing stocks in a wellpositioned country. It requires the thorough study of global trade, sectors, industries, and, most importantly, individual companies. Cost is a major factor for any company looking to diversify its operations or―on the other side of the opportunity window― secure such firms as customers. KPMG International recently undertook a study in an effort to identify the cost of doing business within the manufacturing space by analyzing primary costs such as wages, utilities, real estate, and taxes. Countries that scored well included Malaysia, Mexico, Vietnam, and India.1 They also combined primary costs with secondary costs, including the business environment, regulatory issues, transparency, and the legal protection of property rights. KPMG found that countries that score well in the first category often struggle in the second. The top finishers included Canada—another neighbor that could benefit from its proximity and strong relations with the U.S.—as well as key potential beneficiaries in Asia and Europe.
Asset Class Performance
Equities rallied again, with the S&P 500 advancing 10.6% in the first quarter and nearly 29.9% over the past year. The S&P 500, Dow Jones Industrial Average, and Nasdaq Composite all finished the quarter at or near all-time highs. Returns were driven by strong earning reports, continued healthy consumer spending, and ongoing economic resilience. Earnings expectations were on the rise for many sectors, especially AI-connected companies. The U.S. Federal Reserve continued to signal multiple forthcoming interest rate cuts, even as inflation data remained firmer than expected and investors repeatedly pushed back the timetable for policy easing.
Developed-market equities also advanced substantially, though they trailed the U.S. market, while EM stocks managed only a modest quarterly gain. As mentioned above, Japanese stocks continued to rank among the developed world’s strongest performers. Key European indexes also touched record highs during the quarter, supported by better-than-expected corporate earnings and optimism around potential interest rate cuts by the European Central Bank (ECB) and the Bank of England (BoE).
1 https://assets.kpmg.com/content/dam/kpmg/xx/pdf/2021/06/where-to-manufacture.pdf
By late March, markets were pricing in a 90% chance of an ECB rate cut in June. Many viewed the BoE’s March language as dovish, with rate reductions “in play” at upcoming meetings. The Swiss National Bank cut its primary interest rate in March, making it the first major Western central bank to dial back its tighter monetary policy, which was aimed at tackling inflation. Chinese stocks lagged in January as concerns expanded beyond the country’s property market to include deflationary prices, low consumer confidence, slowing growth, contraction of foreign direct investment, and even long-term demographic issues. In February, China’s rally led EM higher amid stimulus measures, a cut to a key mortgage benchmark, and the central bank lowering the reserve requirement ratio for banks to 2007 levels. However, the market failed to keep pace with much of the EM region.
The Bloomberg U.S. Aggregate Bond Index was down 0.78% during the quarter after a sharp rally to close out 2023. The yield on the 10-year U.S. Treasury bond―reaching a 15-plus-year high above 5% in October 2023―briefly dropped below 4% in late January before rising to close the quarter at 4.2%, as expectations for interest rate cuts faded further into 2024. Highyield bonds managed to post a positive return for the quarter, while investment-grade paper broadly declined but outpaced the Treasury market.
Commodities found some footing after a challenging 2023, as the Bloomberg Commodity Index finished with a modest quarterly gain, though it remained approximately 20% below a multiyear high from June 2022. West Texas Intermediate crude oil prices climbed 16.1% during the quarter but remained well below their recent highs in the fall of 2023. Gold continued to rally after a strong 2023, with spot prices reaching record highs in March, fueled by ongoing geopolitical uncertainty, hopes for interest rate cuts, and technical factors spurring speculation. However, gold remained below historical highs when adjusted for inflation.
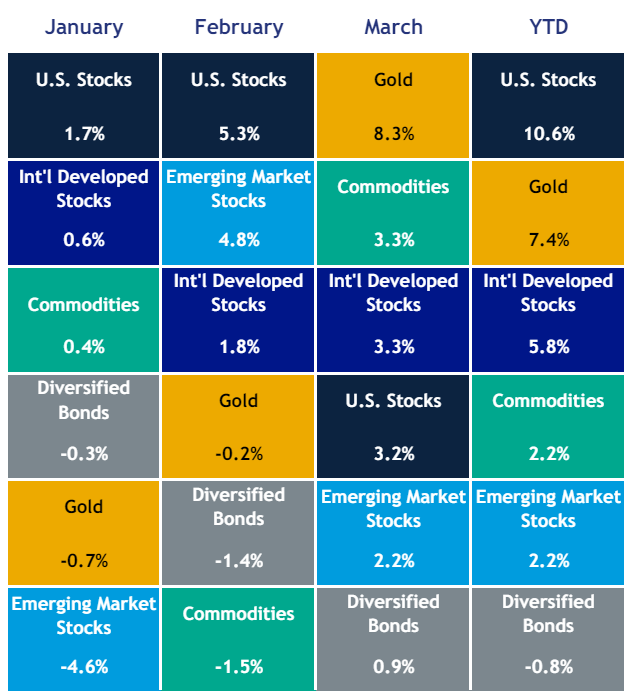
Source: Bloomberg Commodity Index. Indices used: Commodities—Credit Suisse Commodity Index, Diversified Bonds—Bloomberg Aggregate U.S. Bond Index, Gold— S&P GSCI Gold Index, U.S. Stocks—S&P 500 Index, Int’l Developed Stocks—MSCI EAFE Index, Emerging-Market Stocks—MSCI Emerging Markets Index. Indices do not reflect the deduction of advisory fees, transaction charges, and other expenses. You cannot invest directly in an index. Past performance does not indicate future returns.
Conclusion
There is heightened uncertainty surrounding the market, from wars and continuing recessionary signs to questions of growth, inflation, unemployment, and the path of monetary policy for global central banks. Then there are the upcoming elections in the U.S. and around the world. According to some estimates, 49% of the world’s citizens across 64 countries and the European Union have the opportunity to vote in national elections this year. Despite all that, it’s clearly a great time to be an investor, given the wide variety of markets trading at or near all-time highs―with U.S. equities leading the charge.
While we see the value of U.S. stocks, we also suggest looking beyond U.S.-based companies to identify stocks with the appropriate combination of growth and valuation characteristics. Some U.S. companies dominate their respective industries, but we see many international companies with similar metrics. We’ve made the case for potential opportunities in non-U.S. markets in terms of growth and value. For example, Japan’s initiatives to boost shareholder value and the dynamics surrounding supply chain realignment are two areas of focus within our diversification framework. It’s a concept that a lot of advisors lean on in difficult market environments, especially in the wake of a pullback, but we believe it’s just as important when investors’ portfolios are on the rise. Diversification is an essential tool as we all navigate uncertainties, disruptions, the changing global environment, and even a series of impactful worldwide elections.